Immigrants from Bolivia vs Immigrants from Yemen In Labor Force | Age 45-54
COMPARE
Immigrants from Bolivia
Immigrants from Yemen
In Labor Force | Age 45-54
In Labor Force | Age 45-54 Comparison
Immigrants from Bolivia
Immigrants from Yemen
85.3%
IN LABOR FORCE | AGE 45-54
100.0/ 100
METRIC RATING
1st/ 347
METRIC RANK
74.4%
IN LABOR FORCE | AGE 45-54
0.0/ 100
METRIC RATING
344th/ 347
METRIC RANK
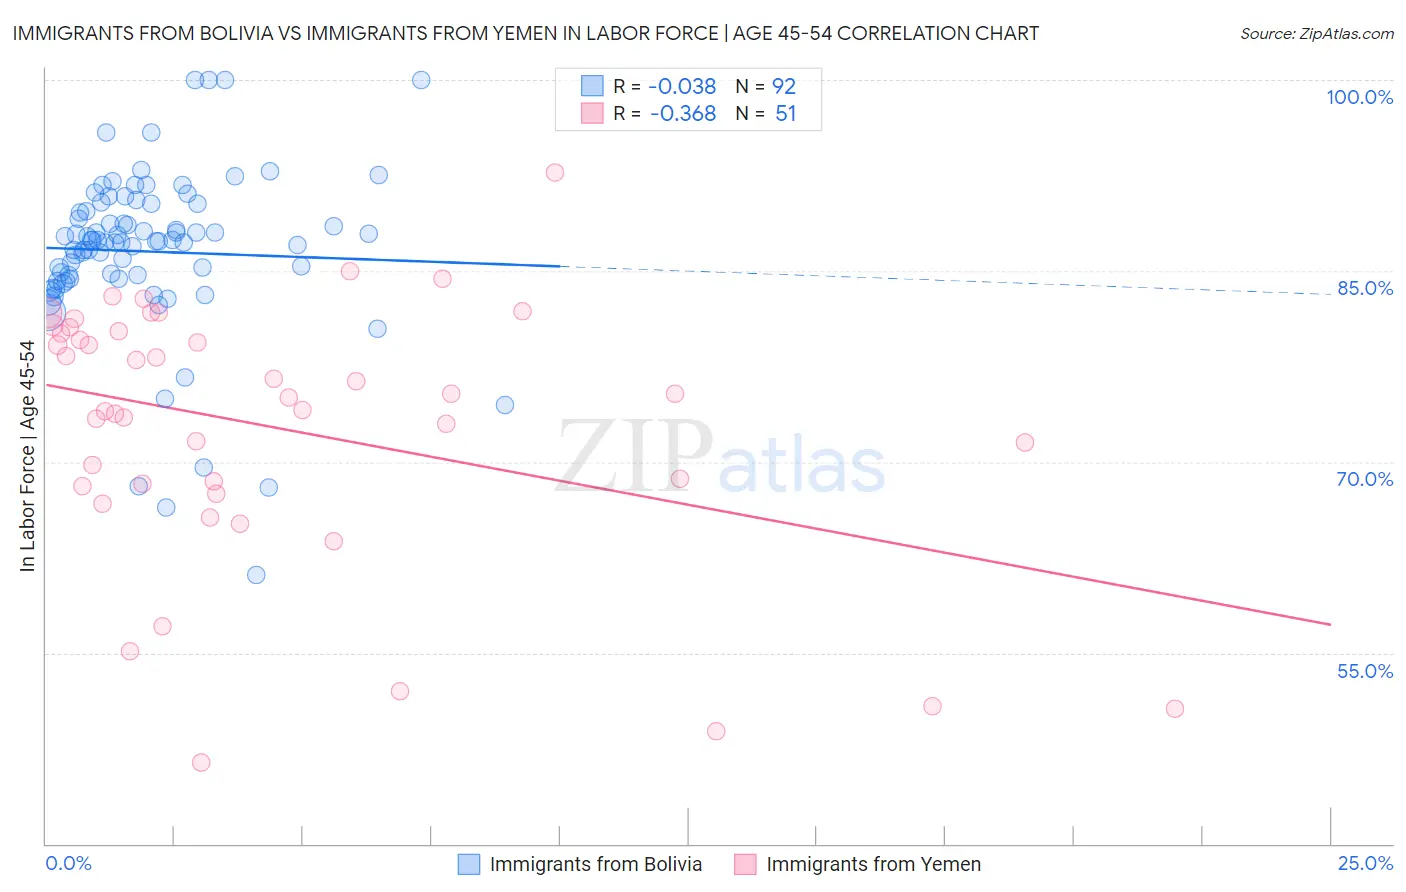
Immigrants from Bolivia vs Immigrants from Yemen In Labor Force | Age 45-54 Correlation Chart
The statistical analysis conducted on geographies consisting of 158,712,400 people shows no correlation between the proportion of Immigrants from Bolivia and labor force participation rate among population between the ages 45 and 54 in the United States with a correlation coefficient (R) of -0.038 and weighted average of 85.3%. Similarly, the statistical analysis conducted on geographies consisting of 82,433,611 people shows a mild negative correlation between the proportion of Immigrants from Yemen and labor force participation rate among population between the ages 45 and 54 in the United States with a correlation coefficient (R) of -0.368 and weighted average of 74.4%, a difference of 14.6%.
In Labor Force | Age 45-54 Correlation Summary
| Measurement | Immigrants from Bolivia | Immigrants from Yemen |
| Minimum | 61.1% | 46.4% |
| Maximum | 100.0% | 92.7% |
| Range | 38.9% | 46.3% |
| Mean | 86.5% | 72.7% |
| Median | 87.3% | 75.1% |
| Interquartile 25% (IQ1) | 84.4% | 68.1% |
| Interquartile 75% (IQ3) | 90.0% | 80.3% |
| Interquartile Range (IQR) | 5.6% | 12.2% |
| Standard Deviation (Sample) | 6.6% | 10.4% |
| Standard Deviation (Population) | 6.6% | 10.3% |
Similar Demographics by In Labor Force | Age 45-54
Demographics Similar to Immigrants from Bolivia by In Labor Force | Age 45-54
In terms of in labor force | age 45-54, the demographic groups most similar to Immigrants from Bolivia are Luxembourger (85.0%, a difference of 0.34%), Bolivian (84.9%, a difference of 0.43%), Immigrants from Ethiopia (84.8%, a difference of 0.55%), Ethiopian (84.8%, a difference of 0.63%), and Immigrants from India (84.7%, a difference of 0.74%).
| Demographics | Rating | Rank | In Labor Force | Age 45-54 |
| Immigrants | Bolivia | 100.0 /100 | #1 | Exceptional 85.3% |
| Luxembourgers | 100.0 /100 | #2 | Exceptional 85.0% |
| Bolivians | 100.0 /100 | #3 | Exceptional 84.9% |
| Immigrants | Ethiopia | 100.0 /100 | #4 | Exceptional 84.8% |
| Ethiopians | 100.0 /100 | #5 | Exceptional 84.8% |
| Immigrants | India | 100.0 /100 | #6 | Exceptional 84.7% |
| Immigrants | Cameroon | 100.0 /100 | #7 | Exceptional 84.6% |
| Sierra Leoneans | 100.0 /100 | #8 | Exceptional 84.5% |
| Immigrants | Sierra Leone | 100.0 /100 | #9 | Exceptional 84.4% |
| Norwegians | 100.0 /100 | #10 | Exceptional 84.4% |
| Thais | 100.0 /100 | #11 | Exceptional 84.3% |
| Bulgarians | 100.0 /100 | #12 | Exceptional 84.2% |
| Chinese | 99.9 /100 | #13 | Exceptional 84.1% |
| Cambodians | 99.9 /100 | #14 | Exceptional 84.1% |
| Cypriots | 99.9 /100 | #15 | Exceptional 84.1% |
Demographics Similar to Immigrants from Yemen by In Labor Force | Age 45-54
In terms of in labor force | age 45-54, the demographic groups most similar to Immigrants from Yemen are Houma (74.1%, a difference of 0.48%), Hopi (75.0%, a difference of 0.78%), Tohono O'odham (75.1%, a difference of 0.96%), Pueblo (75.5%, a difference of 1.5%), and Lumbee (75.6%, a difference of 1.6%).
| Demographics | Rating | Rank | In Labor Force | Age 45-54 |
| Natives/Alaskans | 0.0 /100 | #333 | Tragic 77.1% |
| Apache | 0.0 /100 | #334 | Tragic 77.1% |
| Arapaho | 0.0 /100 | #335 | Tragic 77.1% |
| Paiute | 0.0 /100 | #336 | Tragic 76.7% |
| Ute | 0.0 /100 | #337 | Tragic 76.6% |
| Yuman | 0.0 /100 | #338 | Tragic 76.3% |
| Puerto Ricans | 0.0 /100 | #339 | Tragic 75.9% |
| Lumbee | 0.0 /100 | #340 | Tragic 75.6% |
| Pueblo | 0.0 /100 | #341 | Tragic 75.5% |
| Tohono O'odham | 0.0 /100 | #342 | Tragic 75.1% |
| Hopi | 0.0 /100 | #343 | Tragic 75.0% |
| Immigrants | Yemen | 0.0 /100 | #344 | Tragic 74.4% |
| Houma | 0.0 /100 | #345 | Tragic 74.1% |
| Pima | 0.0 /100 | #346 | Tragic 72.8% |
| Navajo | 0.0 /100 | #347 | Tragic 72.8% |