Vietnamese vs Immigrants from Mexico Disability Age 65 to 74
COMPARE
Vietnamese
Immigrants from Mexico
Disability Age 65 to 74
Disability Age 65 to 74 Comparison
Vietnamese
Immigrants from Mexico
23.2%
DISABILITY AGE 65 TO 74
60.8/ 100
METRIC RATING
165th/ 347
METRIC RANK
27.1%
DISABILITY AGE 65 TO 74
0.0/ 100
METRIC RATING
301st/ 347
METRIC RANK
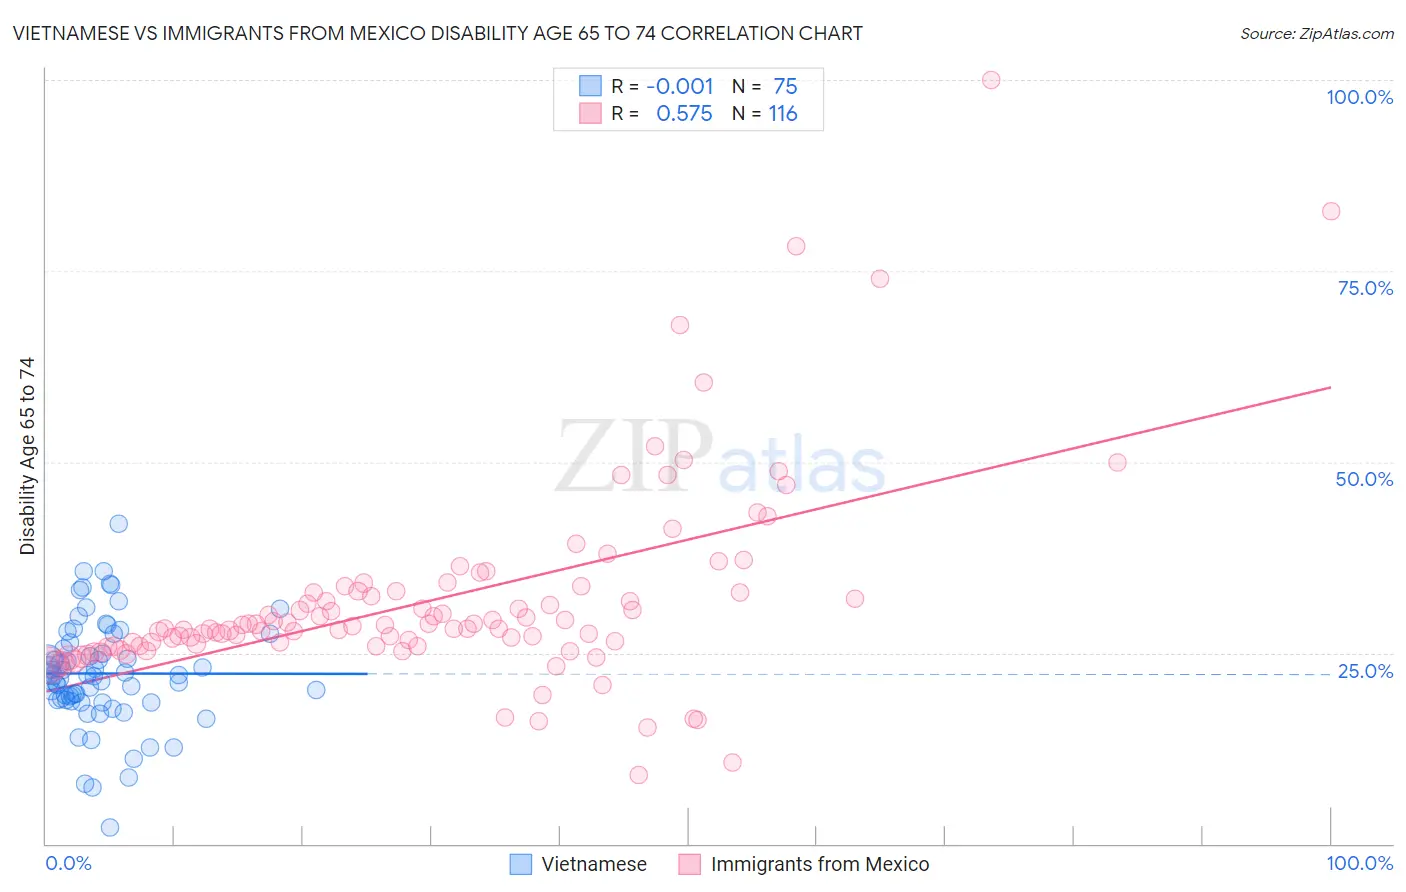
Vietnamese vs Immigrants from Mexico Disability Age 65 to 74 Correlation Chart
The statistical analysis conducted on geographies consisting of 170,489,851 people shows no correlation between the proportion of Vietnamese and percentage of population with a disability between the ages 65 and 75 in the United States with a correlation coefficient (R) of -0.001 and weighted average of 23.2%. Similarly, the statistical analysis conducted on geographies consisting of 512,183,481 people shows a substantial positive correlation between the proportion of Immigrants from Mexico and percentage of population with a disability between the ages 65 and 75 in the United States with a correlation coefficient (R) of 0.575 and weighted average of 27.1%, a difference of 16.9%.
Disability Age 65 to 74 Correlation Summary
| Measurement | Vietnamese | Immigrants from Mexico |
| Minimum | 2.1% | 9.1% |
| Maximum | 41.9% | 100.0% |
| Range | 39.8% | 90.9% |
| Mean | 22.3% | 31.9% |
| Median | 22.0% | 28.4% |
| Interquartile 25% (IQ1) | 18.8% | 25.9% |
| Interquartile 75% (IQ3) | 26.3% | 33.0% |
| Interquartile Range (IQR) | 7.5% | 7.1% |
| Standard Deviation (Sample) | 7.0% | 13.3% |
| Standard Deviation (Population) | 7.0% | 13.2% |
Similar Demographics by Disability Age 65 to 74
Demographics Similar to Vietnamese by Disability Age 65 to 74
In terms of disability age 65 to 74, the demographic groups most similar to Vietnamese are Sierra Leonean (23.2%, a difference of 0.010%), Immigrants from Philippines (23.2%, a difference of 0.020%), Immigrants from Afghanistan (23.2%, a difference of 0.020%), European (23.2%, a difference of 0.030%), and Immigrants from Cameroon (23.1%, a difference of 0.19%).
| Demographics | Rating | Rank | Disability Age 65 to 74 |
| Immigrants | Vietnam | 69.1 /100 | #158 | Good 23.1% |
| South American Indians | 65.5 /100 | #159 | Good 23.1% |
| Koreans | 64.2 /100 | #160 | Good 23.1% |
| Immigrants | Cameroon | 63.8 /100 | #161 | Good 23.1% |
| Europeans | 61.2 /100 | #162 | Good 23.2% |
| Immigrants | Philippines | 61.1 /100 | #163 | Good 23.2% |
| Sierra Leoneans | 60.9 /100 | #164 | Good 23.2% |
| Vietnamese | 60.8 /100 | #165 | Good 23.2% |
| Immigrants | Afghanistan | 60.5 /100 | #166 | Good 23.2% |
| Immigrants | Bosnia and Herzegovina | 57.6 /100 | #167 | Average 23.2% |
| Pakistanis | 57.0 /100 | #168 | Average 23.2% |
| Icelanders | 54.3 /100 | #169 | Average 23.3% |
| Moroccans | 54.2 /100 | #170 | Average 23.3% |
| Cubans | 51.9 /100 | #171 | Average 23.3% |
| Germans | 50.5 /100 | #172 | Average 23.3% |
Demographics Similar to Immigrants from Mexico by Disability Age 65 to 74
In terms of disability age 65 to 74, the demographic groups most similar to Immigrants from Mexico are Central American Indian (27.1%, a difference of 0.010%), Tlingit-Haida (27.1%, a difference of 0.070%), Puget Sound Salish (27.2%, a difference of 0.19%), Mexican (27.2%, a difference of 0.29%), and Immigrants from Dominican Republic (27.0%, a difference of 0.32%).
| Demographics | Rating | Rank | Disability Age 65 to 74 |
| Dominicans | 0.0 /100 | #294 | Tragic 26.7% |
| Hispanics or Latinos | 0.0 /100 | #295 | Tragic 26.7% |
| Bangladeshis | 0.0 /100 | #296 | Tragic 26.8% |
| Fijians | 0.0 /100 | #297 | Tragic 27.0% |
| Immigrants | Yemen | 0.0 /100 | #298 | Tragic 27.0% |
| Potawatomi | 0.0 /100 | #299 | Tragic 27.0% |
| Immigrants | Dominican Republic | 0.0 /100 | #300 | Tragic 27.0% |
| Immigrants | Mexico | 0.0 /100 | #301 | Tragic 27.1% |
| Central American Indians | 0.0 /100 | #302 | Tragic 27.1% |
| Tlingit-Haida | 0.0 /100 | #303 | Tragic 27.1% |
| Puget Sound Salish | 0.0 /100 | #304 | Tragic 27.2% |
| Mexicans | 0.0 /100 | #305 | Tragic 27.2% |
| Blacks/African Americans | 0.0 /100 | #306 | Tragic 27.3% |
| Ute | 0.0 /100 | #307 | Tragic 27.3% |
| Sioux | 0.0 /100 | #308 | Tragic 27.3% |