Venezuelan vs Macedonian In Labor Force | Age 20-24
COMPARE
Venezuelan
Macedonian
In Labor Force | Age 20-24
In Labor Force | Age 20-24 Comparison
Venezuelans
Macedonians
73.3%
IN LABOR FORCE | AGE 20-24
0.2/ 100
METRIC RATING
279th/ 347
METRIC RANK
76.0%
IN LABOR FORCE | AGE 20-24
97.2/ 100
METRIC RATING
104th/ 347
METRIC RANK
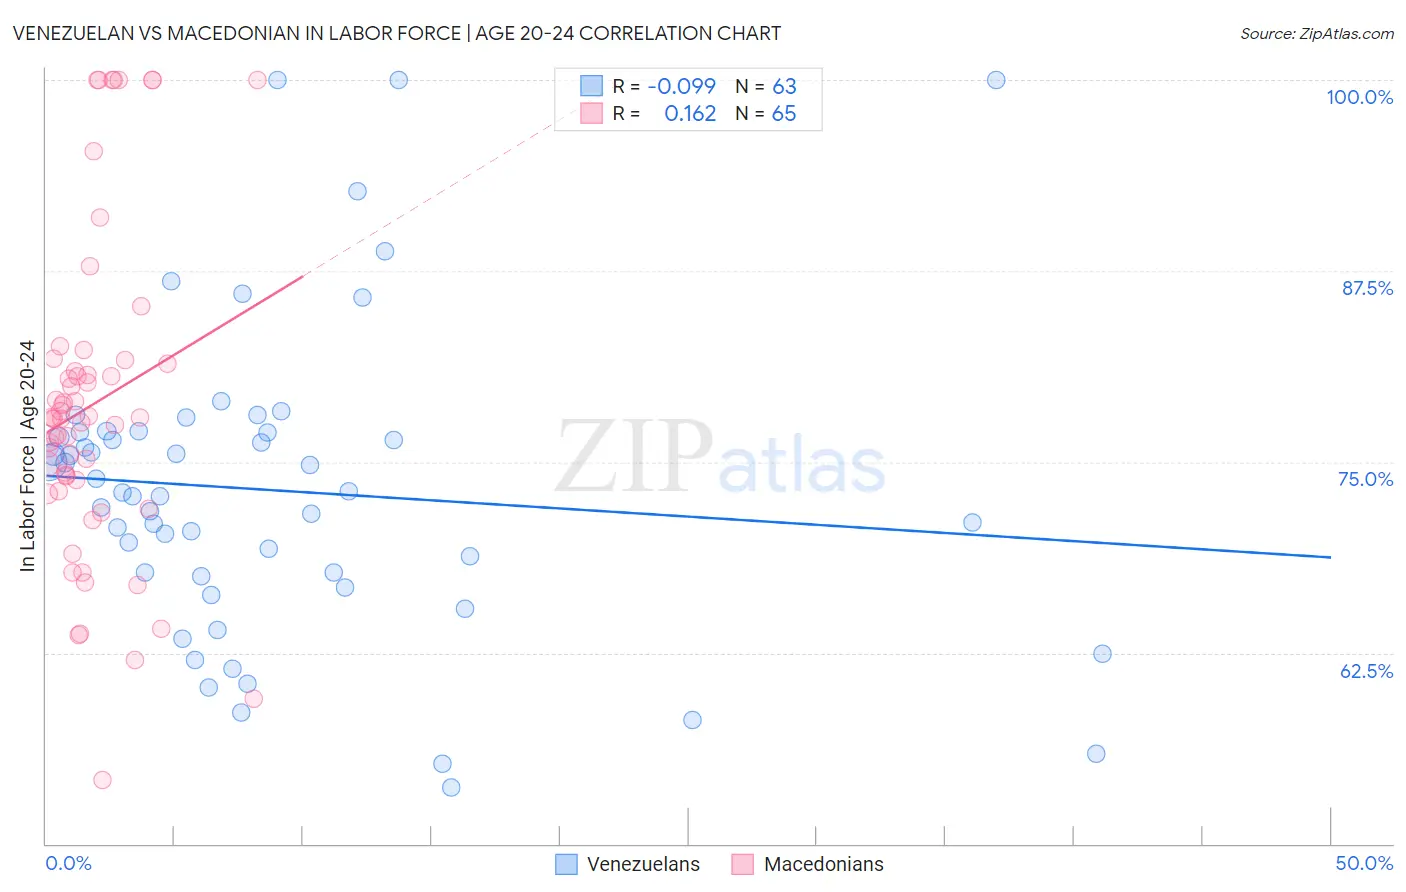
Venezuelan vs Macedonian In Labor Force | Age 20-24 Correlation Chart
The statistical analysis conducted on geographies consisting of 306,312,696 people shows a slight negative correlation between the proportion of Venezuelans and labor force participation rate among population between the ages 20 and 24 in the United States with a correlation coefficient (R) of -0.099 and weighted average of 73.3%. Similarly, the statistical analysis conducted on geographies consisting of 132,643,632 people shows a poor positive correlation between the proportion of Macedonians and labor force participation rate among population between the ages 20 and 24 in the United States with a correlation coefficient (R) of 0.162 and weighted average of 76.0%, a difference of 3.7%.
In Labor Force | Age 20-24 Correlation Summary
| Measurement | Venezuelan | Macedonian |
| Minimum | 53.7% | 54.2% |
| Maximum | 100.0% | 100.0% |
| Range | 46.3% | 45.8% |
| Mean | 73.1% | 78.8% |
| Median | 73.0% | 77.9% |
| Interquartile 25% (IQ1) | 67.5% | 73.5% |
| Interquartile 75% (IQ3) | 76.9% | 81.5% |
| Interquartile Range (IQR) | 9.4% | 8.1% |
| Standard Deviation (Sample) | 10.0% | 10.6% |
| Standard Deviation (Population) | 9.9% | 10.5% |
Similar Demographics by In Labor Force | Age 20-24
Demographics Similar to Venezuelans by In Labor Force | Age 20-24
In terms of in labor force | age 20-24, the demographic groups most similar to Venezuelans are Cypriot (73.3%, a difference of 0.010%), Mongolian (73.3%, a difference of 0.030%), Immigrants from Malaysia (73.3%, a difference of 0.030%), Immigrants from South America (73.3%, a difference of 0.050%), and Bahamian (73.3%, a difference of 0.070%).
| Demographics | Rating | Rank | In Labor Force | Age 20-24 |
| Belizeans | 0.3 /100 | #272 | Tragic 73.4% |
| Cheyenne | 0.2 /100 | #273 | Tragic 73.4% |
| Immigrants | Colombia | 0.2 /100 | #274 | Tragic 73.4% |
| Immigrants | South America | 0.2 /100 | #275 | Tragic 73.3% |
| Mongolians | 0.2 /100 | #276 | Tragic 73.3% |
| Immigrants | Malaysia | 0.2 /100 | #277 | Tragic 73.3% |
| Cypriots | 0.2 /100 | #278 | Tragic 73.3% |
| Venezuelans | 0.2 /100 | #279 | Tragic 73.3% |
| Bahamians | 0.1 /100 | #280 | Tragic 73.3% |
| Immigrants | Venezuela | 0.1 /100 | #281 | Tragic 73.2% |
| Immigrants | Spain | 0.1 /100 | #282 | Tragic 73.2% |
| Immigrants | Bahamas | 0.1 /100 | #283 | Tragic 73.2% |
| Kiowa | 0.1 /100 | #284 | Tragic 73.2% |
| Nicaraguans | 0.1 /100 | #285 | Tragic 73.2% |
| Immigrants | Lebanon | 0.1 /100 | #286 | Tragic 73.1% |
Demographics Similar to Macedonians by In Labor Force | Age 20-24
In terms of in labor force | age 20-24, the demographic groups most similar to Macedonians are Immigrants from Nepal (76.0%, a difference of 0.0%), Immigrants from Uganda (76.0%, a difference of 0.020%), Immigrants from North Macedonia (76.1%, a difference of 0.040%), Greek (76.0%, a difference of 0.040%), and Latvian (76.1%, a difference of 0.060%).
| Demographics | Rating | Rank | In Labor Force | Age 20-24 |
| Immigrants | Lithuania | 98.0 /100 | #97 | Exceptional 76.1% |
| Immigrants | Oceania | 98.0 /100 | #98 | Exceptional 76.1% |
| Americans | 97.8 /100 | #99 | Exceptional 76.1% |
| Shoshone | 97.8 /100 | #100 | Exceptional 76.1% |
| Immigrants | Poland | 97.7 /100 | #101 | Exceptional 76.1% |
| Latvians | 97.6 /100 | #102 | Exceptional 76.1% |
| Immigrants | North Macedonia | 97.5 /100 | #103 | Exceptional 76.1% |
| Macedonians | 97.2 /100 | #104 | Exceptional 76.0% |
| Immigrants | Nepal | 97.2 /100 | #105 | Exceptional 76.0% |
| Immigrants | Uganda | 97.1 /100 | #106 | Exceptional 76.0% |
| Greeks | 96.9 /100 | #107 | Exceptional 76.0% |
| Iraqis | 96.6 /100 | #108 | Exceptional 76.0% |
| Cherokee | 95.8 /100 | #109 | Exceptional 75.9% |
| Immigrants | Morocco | 95.8 /100 | #110 | Exceptional 75.9% |
| Ukrainians | 95.7 /100 | #111 | Exceptional 75.9% |