Bhutanese vs Macedonian In Labor Force | Age 20-24
COMPARE
Bhutanese
Macedonian
In Labor Force | Age 20-24
In Labor Force | Age 20-24 Comparison
Bhutanese
Macedonians
75.4%
IN LABOR FORCE | AGE 20-24
80.8/ 100
METRIC RATING
144th/ 347
METRIC RANK
76.0%
IN LABOR FORCE | AGE 20-24
97.2/ 100
METRIC RATING
104th/ 347
METRIC RANK
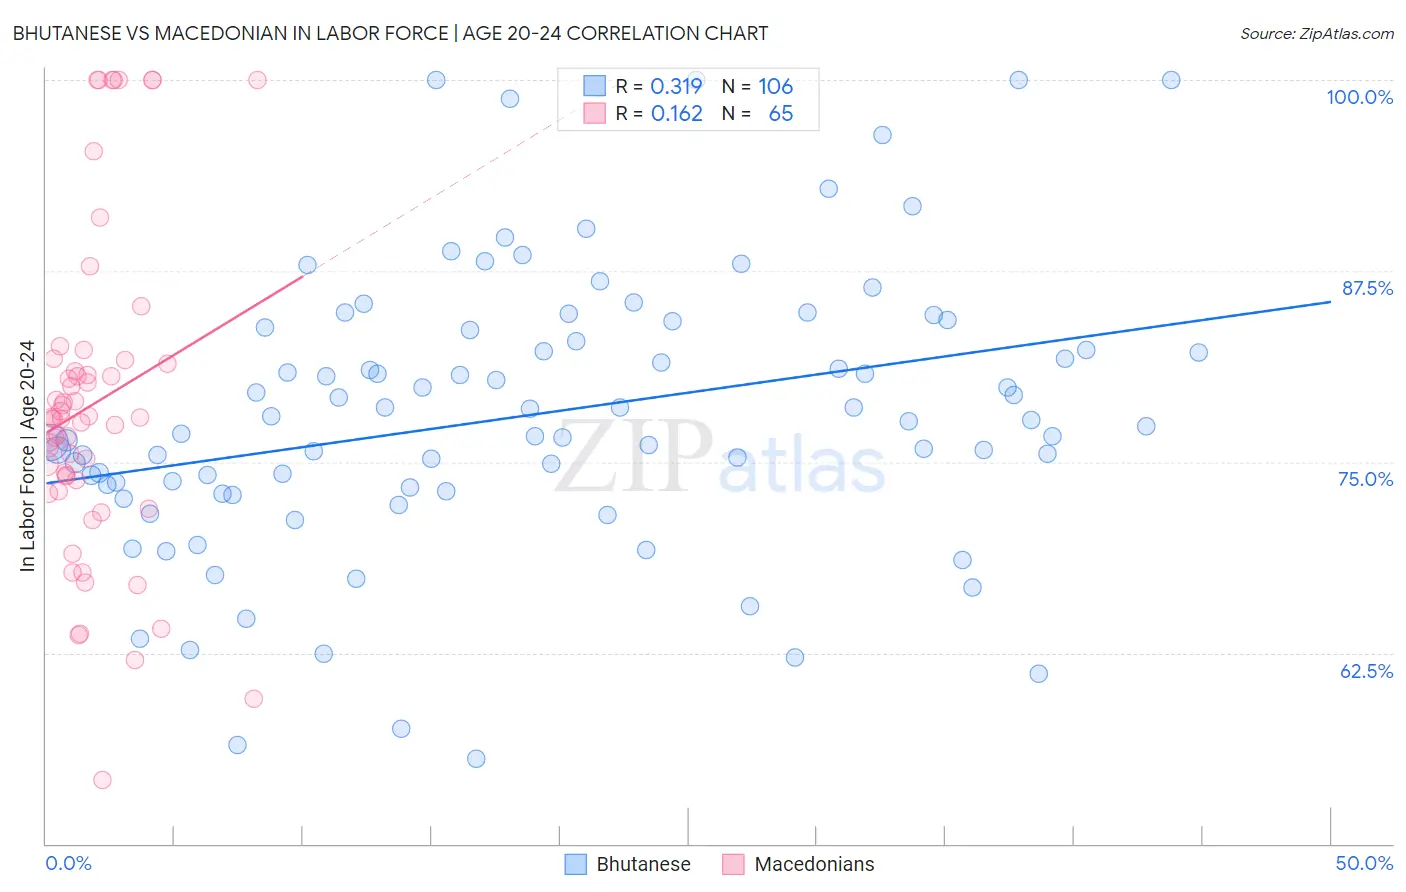
Bhutanese vs Macedonian In Labor Force | Age 20-24 Correlation Chart
The statistical analysis conducted on geographies consisting of 455,273,075 people shows a mild positive correlation between the proportion of Bhutanese and labor force participation rate among population between the ages 20 and 24 in the United States with a correlation coefficient (R) of 0.319 and weighted average of 75.4%. Similarly, the statistical analysis conducted on geographies consisting of 132,643,632 people shows a poor positive correlation between the proportion of Macedonians and labor force participation rate among population between the ages 20 and 24 in the United States with a correlation coefficient (R) of 0.162 and weighted average of 76.0%, a difference of 0.77%.
In Labor Force | Age 20-24 Correlation Summary
| Measurement | Bhutanese | Macedonian |
| Minimum | 55.6% | 54.2% |
| Maximum | 100.0% | 100.0% |
| Range | 44.4% | 45.8% |
| Mean | 78.1% | 78.8% |
| Median | 77.5% | 77.9% |
| Interquartile 25% (IQ1) | 73.3% | 73.5% |
| Interquartile 75% (IQ3) | 83.6% | 81.5% |
| Interquartile Range (IQR) | 10.3% | 8.1% |
| Standard Deviation (Sample) | 9.2% | 10.6% |
| Standard Deviation (Population) | 9.1% | 10.5% |
Similar Demographics by In Labor Force | Age 20-24
Demographics Similar to Bhutanese by In Labor Force | Age 20-24
In terms of in labor force | age 20-24, the demographic groups most similar to Bhutanese are Spaniard (75.5%, a difference of 0.030%), Korean (75.4%, a difference of 0.030%), Mexican American Indian (75.4%, a difference of 0.050%), Blackfeet (75.5%, a difference of 0.070%), and Comanche (75.4%, a difference of 0.070%).
| Demographics | Rating | Rank | In Labor Force | Age 20-24 |
| Jordanians | 84.8 /100 | #137 | Excellent 75.5% |
| Australians | 84.8 /100 | #138 | Excellent 75.5% |
| Immigrants | England | 84.6 /100 | #139 | Excellent 75.5% |
| Delaware | 84.5 /100 | #140 | Excellent 75.5% |
| Romanians | 84.1 /100 | #141 | Excellent 75.5% |
| Blackfeet | 83.6 /100 | #142 | Excellent 75.5% |
| Spaniards | 82.0 /100 | #143 | Excellent 75.5% |
| Bhutanese | 80.8 /100 | #144 | Excellent 75.4% |
| Koreans | 79.7 /100 | #145 | Good 75.4% |
| Mexican American Indians | 78.8 /100 | #146 | Good 75.4% |
| Comanche | 77.6 /100 | #147 | Good 75.4% |
| Immigrants | Cambodia | 76.7 /100 | #148 | Good 75.4% |
| Ugandans | 76.1 /100 | #149 | Good 75.4% |
| Salvadorans | 74.8 /100 | #150 | Good 75.3% |
| Paiute | 74.1 /100 | #151 | Good 75.3% |
Demographics Similar to Macedonians by In Labor Force | Age 20-24
In terms of in labor force | age 20-24, the demographic groups most similar to Macedonians are Immigrants from Nepal (76.0%, a difference of 0.0%), Immigrants from Uganda (76.0%, a difference of 0.020%), Immigrants from North Macedonia (76.1%, a difference of 0.040%), Greek (76.0%, a difference of 0.040%), and Latvian (76.1%, a difference of 0.060%).
| Demographics | Rating | Rank | In Labor Force | Age 20-24 |
| Immigrants | Lithuania | 98.0 /100 | #97 | Exceptional 76.1% |
| Immigrants | Oceania | 98.0 /100 | #98 | Exceptional 76.1% |
| Americans | 97.8 /100 | #99 | Exceptional 76.1% |
| Shoshone | 97.8 /100 | #100 | Exceptional 76.1% |
| Immigrants | Poland | 97.7 /100 | #101 | Exceptional 76.1% |
| Latvians | 97.6 /100 | #102 | Exceptional 76.1% |
| Immigrants | North Macedonia | 97.5 /100 | #103 | Exceptional 76.1% |
| Macedonians | 97.2 /100 | #104 | Exceptional 76.0% |
| Immigrants | Nepal | 97.2 /100 | #105 | Exceptional 76.0% |
| Immigrants | Uganda | 97.1 /100 | #106 | Exceptional 76.0% |
| Greeks | 96.9 /100 | #107 | Exceptional 76.0% |
| Iraqis | 96.6 /100 | #108 | Exceptional 76.0% |
| Cherokee | 95.8 /100 | #109 | Exceptional 75.9% |
| Immigrants | Morocco | 95.8 /100 | #110 | Exceptional 75.9% |
| Ukrainians | 95.7 /100 | #111 | Exceptional 75.9% |