Venezuelan vs Macedonian Professional Degree
COMPARE
Venezuelan
Macedonian
Professional Degree
Professional Degree Comparison
Venezuelans
Macedonians
4.9%
PROFESSIONAL DEGREE
96.3/ 100
METRIC RATING
116th/ 347
METRIC RANK
4.8%
PROFESSIONAL DEGREE
89.8/ 100
METRIC RATING
135th/ 347
METRIC RANK
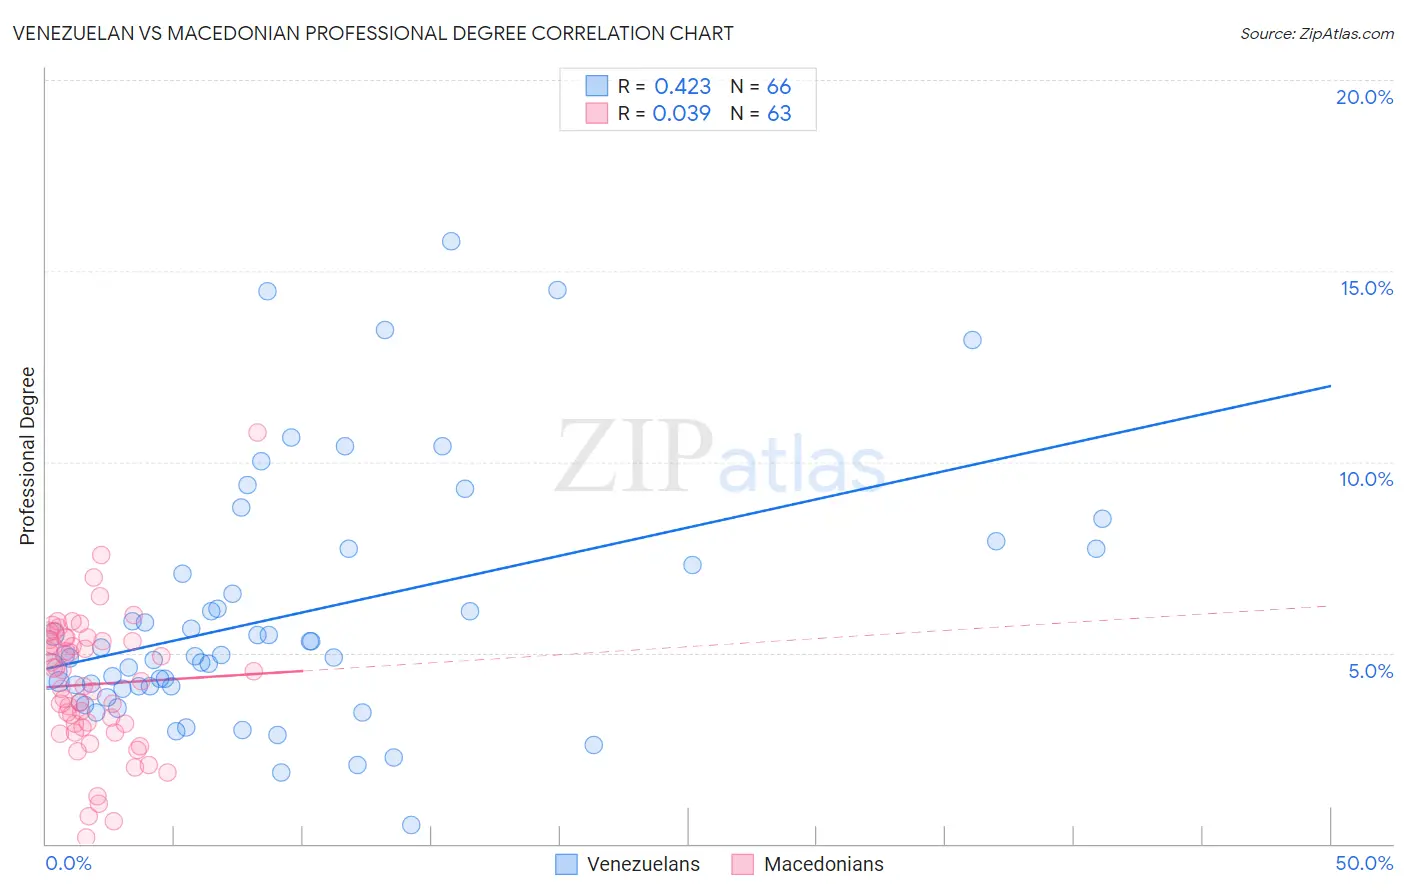
Venezuelan vs Macedonian Professional Degree Correlation Chart
The statistical analysis conducted on geographies consisting of 305,937,617 people shows a moderate positive correlation between the proportion of Venezuelans and percentage of population with at least professional degree education in the United States with a correlation coefficient (R) of 0.423 and weighted average of 4.9%. Similarly, the statistical analysis conducted on geographies consisting of 132,425,938 people shows no correlation between the proportion of Macedonians and percentage of population with at least professional degree education in the United States with a correlation coefficient (R) of 0.039 and weighted average of 4.8%, a difference of 3.6%.
Professional Degree Correlation Summary
| Measurement | Venezuelan | Macedonian |
| Minimum | 0.50% | 0.16% |
| Maximum | 15.8% | 10.8% |
| Range | 15.3% | 10.6% |
| Mean | 6.0% | 4.2% |
| Median | 4.9% | 4.2% |
| Interquartile 25% (IQ1) | 4.1% | 3.0% |
| Interquartile 75% (IQ3) | 7.3% | 5.3% |
| Interquartile Range (IQR) | 3.2% | 2.3% |
| Standard Deviation (Sample) | 3.2% | 1.8% |
| Standard Deviation (Population) | 3.2% | 1.8% |
Demographics Similar to Venezuelans and Macedonians by Professional Degree
In terms of professional degree, the demographic groups most similar to Venezuelans are Immigrants from Syria (4.9%, a difference of 0.21%), Croatian (4.9%, a difference of 0.21%), Moroccan (5.0%, a difference of 0.47%), Immigrants from Sudan (4.9%, a difference of 0.75%), and Albanian (4.9%, a difference of 0.76%). Similarly, the demographic groups most similar to Macedonians are South American Indian (4.8%, a difference of 0.040%), Italian (4.8%, a difference of 0.16%), Pakistani (4.8%, a difference of 0.41%), Immigrants from Nepal (4.8%, a difference of 0.64%), and Icelander (4.8%, a difference of 0.66%).
| Demographics | Rating | Rank | Professional Degree |
| Moroccans | 96.8 /100 | #115 | Exceptional 5.0% |
| Venezuelans | 96.3 /100 | #116 | Exceptional 4.9% |
| Immigrants | Syria | 96.0 /100 | #117 | Exceptional 4.9% |
| Croatians | 96.0 /100 | #118 | Exceptional 4.9% |
| Immigrants | Sudan | 95.4 /100 | #119 | Exceptional 4.9% |
| Albanians | 95.3 /100 | #120 | Exceptional 4.9% |
| Immigrants | Moldova | 94.8 /100 | #121 | Exceptional 4.9% |
| Immigrants | Germany | 94.1 /100 | #122 | Exceptional 4.9% |
| Immigrants | Venezuela | 93.8 /100 | #123 | Exceptional 4.8% |
| Immigrants | Eritrea | 93.5 /100 | #124 | Exceptional 4.8% |
| Immigrants | Albania | 93.3 /100 | #125 | Exceptional 4.8% |
| Europeans | 93.2 /100 | #126 | Exceptional 4.8% |
| Serbians | 92.6 /100 | #127 | Exceptional 4.8% |
| Immigrants | Eastern Africa | 92.5 /100 | #128 | Exceptional 4.8% |
| Palestinians | 91.5 /100 | #129 | Exceptional 4.8% |
| Icelanders | 91.5 /100 | #130 | Exceptional 4.8% |
| Immigrants | Nepal | 91.4 /100 | #131 | Exceptional 4.8% |
| Pakistanis | 90.9 /100 | #132 | Exceptional 4.8% |
| Italians | 90.2 /100 | #133 | Exceptional 4.8% |
| South American Indians | 89.9 /100 | #134 | Excellent 4.8% |
| Macedonians | 89.8 /100 | #135 | Excellent 4.8% |