Venezuelan vs Immigrants from Cuba In Labor Force | Age 20-24
COMPARE
Venezuelan
Immigrants from Cuba
In Labor Force | Age 20-24
In Labor Force | Age 20-24 Comparison
Venezuelans
Immigrants from Cuba
73.3%
IN LABOR FORCE | AGE 20-24
0.2/ 100
METRIC RATING
279th/ 347
METRIC RANK
72.0%
IN LABOR FORCE | AGE 20-24
0.0/ 100
METRIC RATING
310th/ 347
METRIC RANK
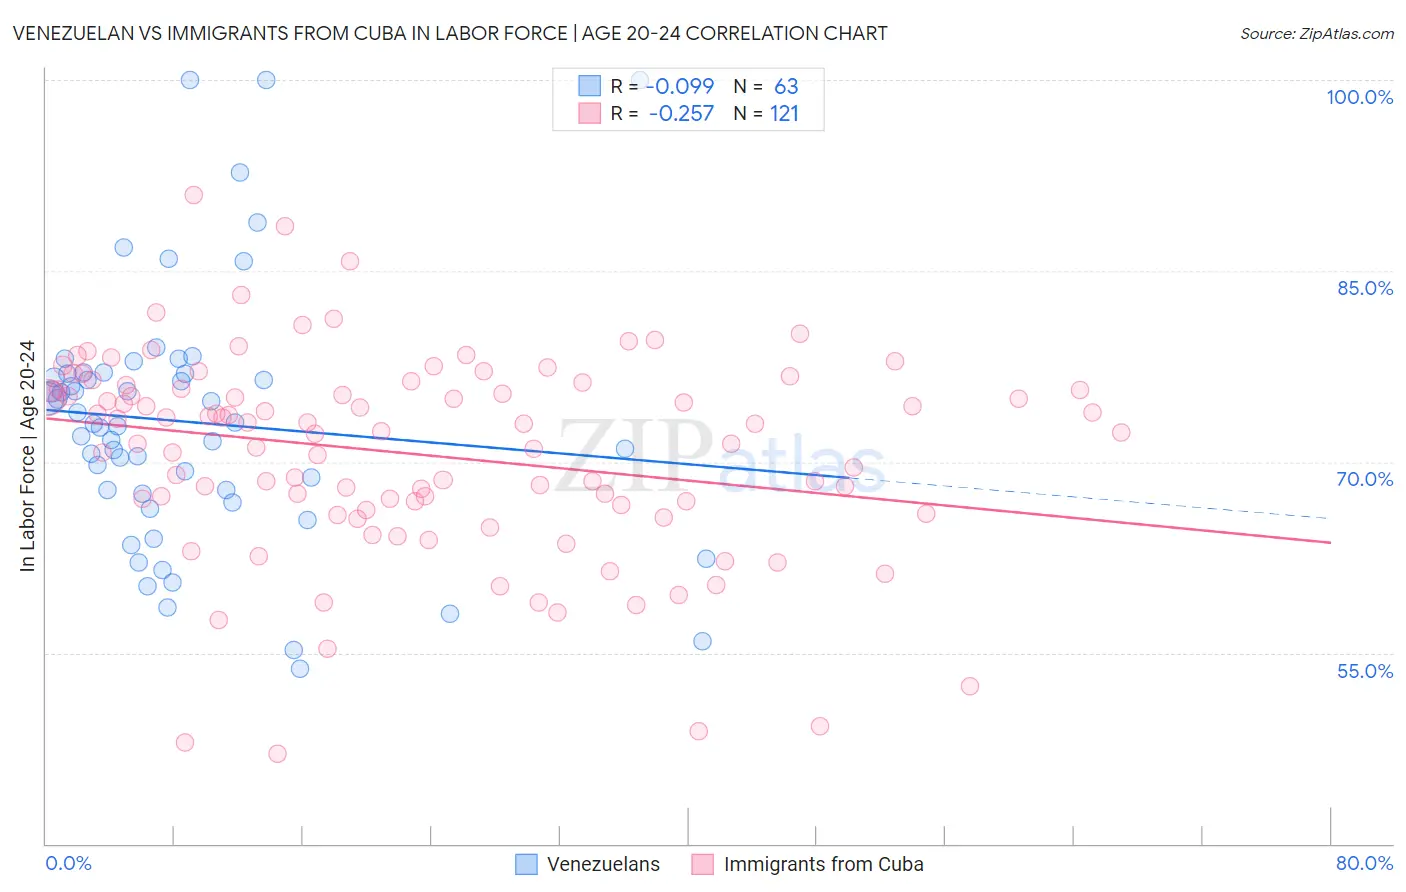
Venezuelan vs Immigrants from Cuba In Labor Force | Age 20-24 Correlation Chart
The statistical analysis conducted on geographies consisting of 306,312,696 people shows a slight negative correlation between the proportion of Venezuelans and labor force participation rate among population between the ages 20 and 24 in the United States with a correlation coefficient (R) of -0.099 and weighted average of 73.3%. Similarly, the statistical analysis conducted on geographies consisting of 325,873,529 people shows a weak negative correlation between the proportion of Immigrants from Cuba and labor force participation rate among population between the ages 20 and 24 in the United States with a correlation coefficient (R) of -0.257 and weighted average of 72.0%, a difference of 1.8%.
In Labor Force | Age 20-24 Correlation Summary
| Measurement | Venezuelan | Immigrants from Cuba |
| Minimum | 53.7% | 47.0% |
| Maximum | 100.0% | 91.0% |
| Range | 46.3% | 43.9% |
| Mean | 73.1% | 70.6% |
| Median | 73.0% | 72.4% |
| Interquartile 25% (IQ1) | 67.5% | 66.4% |
| Interquartile 75% (IQ3) | 76.9% | 75.7% |
| Interquartile Range (IQR) | 9.4% | 9.3% |
| Standard Deviation (Sample) | 10.0% | 8.0% |
| Standard Deviation (Population) | 9.9% | 8.0% |
Similar Demographics by In Labor Force | Age 20-24
Demographics Similar to Venezuelans by In Labor Force | Age 20-24
In terms of in labor force | age 20-24, the demographic groups most similar to Venezuelans are Cypriot (73.3%, a difference of 0.010%), Mongolian (73.3%, a difference of 0.030%), Immigrants from Malaysia (73.3%, a difference of 0.030%), Immigrants from South America (73.3%, a difference of 0.050%), and Bahamian (73.3%, a difference of 0.070%).
| Demographics | Rating | Rank | In Labor Force | Age 20-24 |
| Belizeans | 0.3 /100 | #272 | Tragic 73.4% |
| Cheyenne | 0.2 /100 | #273 | Tragic 73.4% |
| Immigrants | Colombia | 0.2 /100 | #274 | Tragic 73.4% |
| Immigrants | South America | 0.2 /100 | #275 | Tragic 73.3% |
| Mongolians | 0.2 /100 | #276 | Tragic 73.3% |
| Immigrants | Malaysia | 0.2 /100 | #277 | Tragic 73.3% |
| Cypriots | 0.2 /100 | #278 | Tragic 73.3% |
| Venezuelans | 0.2 /100 | #279 | Tragic 73.3% |
| Bahamians | 0.1 /100 | #280 | Tragic 73.3% |
| Immigrants | Venezuela | 0.1 /100 | #281 | Tragic 73.2% |
| Immigrants | Spain | 0.1 /100 | #282 | Tragic 73.2% |
| Immigrants | Bahamas | 0.1 /100 | #283 | Tragic 73.2% |
| Kiowa | 0.1 /100 | #284 | Tragic 73.2% |
| Nicaraguans | 0.1 /100 | #285 | Tragic 73.2% |
| Immigrants | Lebanon | 0.1 /100 | #286 | Tragic 73.1% |
Demographics Similar to Immigrants from Cuba by In Labor Force | Age 20-24
In terms of in labor force | age 20-24, the demographic groups most similar to Immigrants from Cuba are Apache (72.0%, a difference of 0.010%), Immigrants from Caribbean (71.9%, a difference of 0.080%), Immigrants from Dominica (71.9%, a difference of 0.13%), Indian (Asian) (71.9%, a difference of 0.14%), and Immigrants from Iran (71.8%, a difference of 0.22%).
| Demographics | Rating | Rank | In Labor Force | Age 20-24 |
| Ecuadorians | 0.0 /100 | #303 | Tragic 72.4% |
| Immigrants | West Indies | 0.0 /100 | #304 | Tragic 72.4% |
| Immigrants | Singapore | 0.0 /100 | #305 | Tragic 72.4% |
| Immigrants | Jamaica | 0.0 /100 | #306 | Tragic 72.4% |
| Immigrants | Ecuador | 0.0 /100 | #307 | Tragic 72.3% |
| Soviet Union | 0.0 /100 | #308 | Tragic 72.3% |
| Tsimshian | 0.0 /100 | #309 | Tragic 72.3% |
| Immigrants | Cuba | 0.0 /100 | #310 | Tragic 72.0% |
| Apache | 0.0 /100 | #311 | Tragic 72.0% |
| Immigrants | Caribbean | 0.0 /100 | #312 | Tragic 71.9% |
| Immigrants | Dominica | 0.0 /100 | #313 | Tragic 71.9% |
| Indians (Asian) | 0.0 /100 | #314 | Tragic 71.9% |
| Immigrants | Iran | 0.0 /100 | #315 | Tragic 71.8% |
| Immigrants | Eastern Asia | 0.0 /100 | #316 | Tragic 71.8% |
| Immigrants | Armenia | 0.0 /100 | #317 | Tragic 71.7% |