Immigrants from Southern Europe vs Macedonian In Labor Force | Age 20-24
COMPARE
Immigrants from Southern Europe
Macedonian
In Labor Force | Age 20-24
In Labor Force | Age 20-24 Comparison
Immigrants from Southern Europe
Macedonians
74.5%
IN LABOR FORCE | AGE 20-24
13.2/ 100
METRIC RATING
214th/ 347
METRIC RANK
76.0%
IN LABOR FORCE | AGE 20-24
97.2/ 100
METRIC RATING
104th/ 347
METRIC RANK
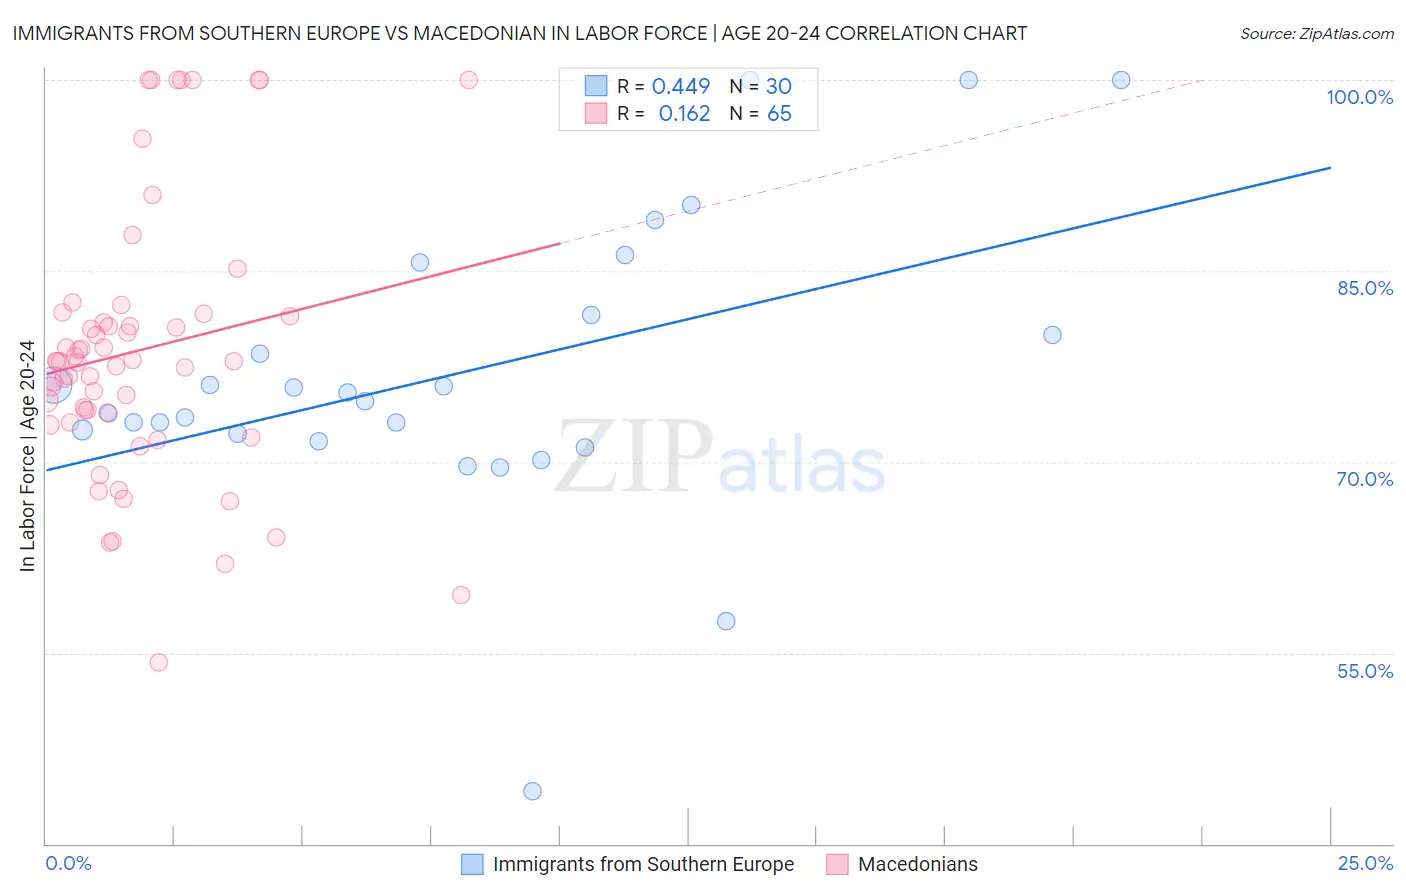
Immigrants from Southern Europe vs Macedonian In Labor Force | Age 20-24 Correlation Chart
The statistical analysis conducted on geographies consisting of 402,559,675 people shows a moderate positive correlation between the proportion of Immigrants from Southern Europe and labor force participation rate among population between the ages 20 and 24 in the United States with a correlation coefficient (R) of 0.449 and weighted average of 74.5%. Similarly, the statistical analysis conducted on geographies consisting of 132,643,632 people shows a poor positive correlation between the proportion of Macedonians and labor force participation rate among population between the ages 20 and 24 in the United States with a correlation coefficient (R) of 0.162 and weighted average of 76.0%, a difference of 2.0%.
In Labor Force | Age 20-24 Correlation Summary
| Measurement | Immigrants from Southern Europe | Macedonian |
| Minimum | 44.1% | 54.2% |
| Maximum | 100.0% | 100.0% |
| Range | 55.9% | 45.8% |
| Mean | 77.0% | 78.8% |
| Median | 75.1% | 77.9% |
| Interquartile 25% (IQ1) | 72.2% | 73.5% |
| Interquartile 75% (IQ3) | 81.5% | 81.5% |
| Interquartile Range (IQR) | 9.3% | 8.1% |
| Standard Deviation (Sample) | 11.6% | 10.6% |
| Standard Deviation (Population) | 11.4% | 10.5% |
Similar Demographics by In Labor Force | Age 20-24
Demographics Similar to Immigrants from Southern Europe by In Labor Force | Age 20-24
In terms of in labor force | age 20-24, the demographic groups most similar to Immigrants from Southern Europe are Creek (74.5%, a difference of 0.0%), Peruvian (74.5%, a difference of 0.0%), Immigrants from Ghana (74.5%, a difference of 0.020%), Immigrants from Kuwait (74.5%, a difference of 0.020%), and Chilean (74.5%, a difference of 0.020%).
| Demographics | Rating | Rank | In Labor Force | Age 20-24 |
| Albanians | 16.2 /100 | #207 | Poor 74.6% |
| Immigrants | Uruguay | 15.8 /100 | #208 | Poor 74.6% |
| Arabs | 15.8 /100 | #209 | Poor 74.6% |
| Uruguayans | 15.1 /100 | #210 | Poor 74.6% |
| Immigrants | Australia | 14.7 /100 | #211 | Poor 74.6% |
| Creek | 13.3 /100 | #212 | Poor 74.5% |
| Peruvians | 13.3 /100 | #213 | Poor 74.5% |
| Immigrants | Southern Europe | 13.2 /100 | #214 | Poor 74.5% |
| Immigrants | Ghana | 12.7 /100 | #215 | Poor 74.5% |
| Immigrants | Kuwait | 12.7 /100 | #216 | Poor 74.5% |
| Chileans | 12.5 /100 | #217 | Poor 74.5% |
| Immigrants | Peru | 10.6 /100 | #218 | Poor 74.5% |
| Nepalese | 10.5 /100 | #219 | Poor 74.5% |
| Immigrants | Norway | 10.3 /100 | #220 | Poor 74.5% |
| Chickasaw | 10.3 /100 | #221 | Poor 74.5% |
Demographics Similar to Macedonians by In Labor Force | Age 20-24
In terms of in labor force | age 20-24, the demographic groups most similar to Macedonians are Immigrants from Nepal (76.0%, a difference of 0.0%), Immigrants from Uganda (76.0%, a difference of 0.020%), Immigrants from North Macedonia (76.1%, a difference of 0.040%), Greek (76.0%, a difference of 0.040%), and Latvian (76.1%, a difference of 0.060%).
| Demographics | Rating | Rank | In Labor Force | Age 20-24 |
| Immigrants | Lithuania | 98.0 /100 | #97 | Exceptional 76.1% |
| Immigrants | Oceania | 98.0 /100 | #98 | Exceptional 76.1% |
| Americans | 97.8 /100 | #99 | Exceptional 76.1% |
| Shoshone | 97.8 /100 | #100 | Exceptional 76.1% |
| Immigrants | Poland | 97.7 /100 | #101 | Exceptional 76.1% |
| Latvians | 97.6 /100 | #102 | Exceptional 76.1% |
| Immigrants | North Macedonia | 97.5 /100 | #103 | Exceptional 76.1% |
| Macedonians | 97.2 /100 | #104 | Exceptional 76.0% |
| Immigrants | Nepal | 97.2 /100 | #105 | Exceptional 76.0% |
| Immigrants | Uganda | 97.1 /100 | #106 | Exceptional 76.0% |
| Greeks | 96.9 /100 | #107 | Exceptional 76.0% |
| Iraqis | 96.6 /100 | #108 | Exceptional 76.0% |
| Cherokee | 95.8 /100 | #109 | Exceptional 75.9% |
| Immigrants | Morocco | 95.8 /100 | #110 | Exceptional 75.9% |
| Ukrainians | 95.7 /100 | #111 | Exceptional 75.9% |