Venezuelan vs Hawaiian Unemployment Among Ages 25 to 29 years
COMPARE
Venezuelan
Hawaiian
Unemployment Among Ages 25 to 29 years
Unemployment Among Ages 25 to 29 years Comparison
Venezuelans
Hawaiians
6.2%
UNEMPLOYMENT AMONG AGES 25 TO 29 YEARS
99.1/ 100
METRIC RATING
45th/ 347
METRIC RANK
6.8%
UNEMPLOYMENT AMONG AGES 25 TO 29 YEARS
17.1/ 100
METRIC RATING
209th/ 347
METRIC RANK
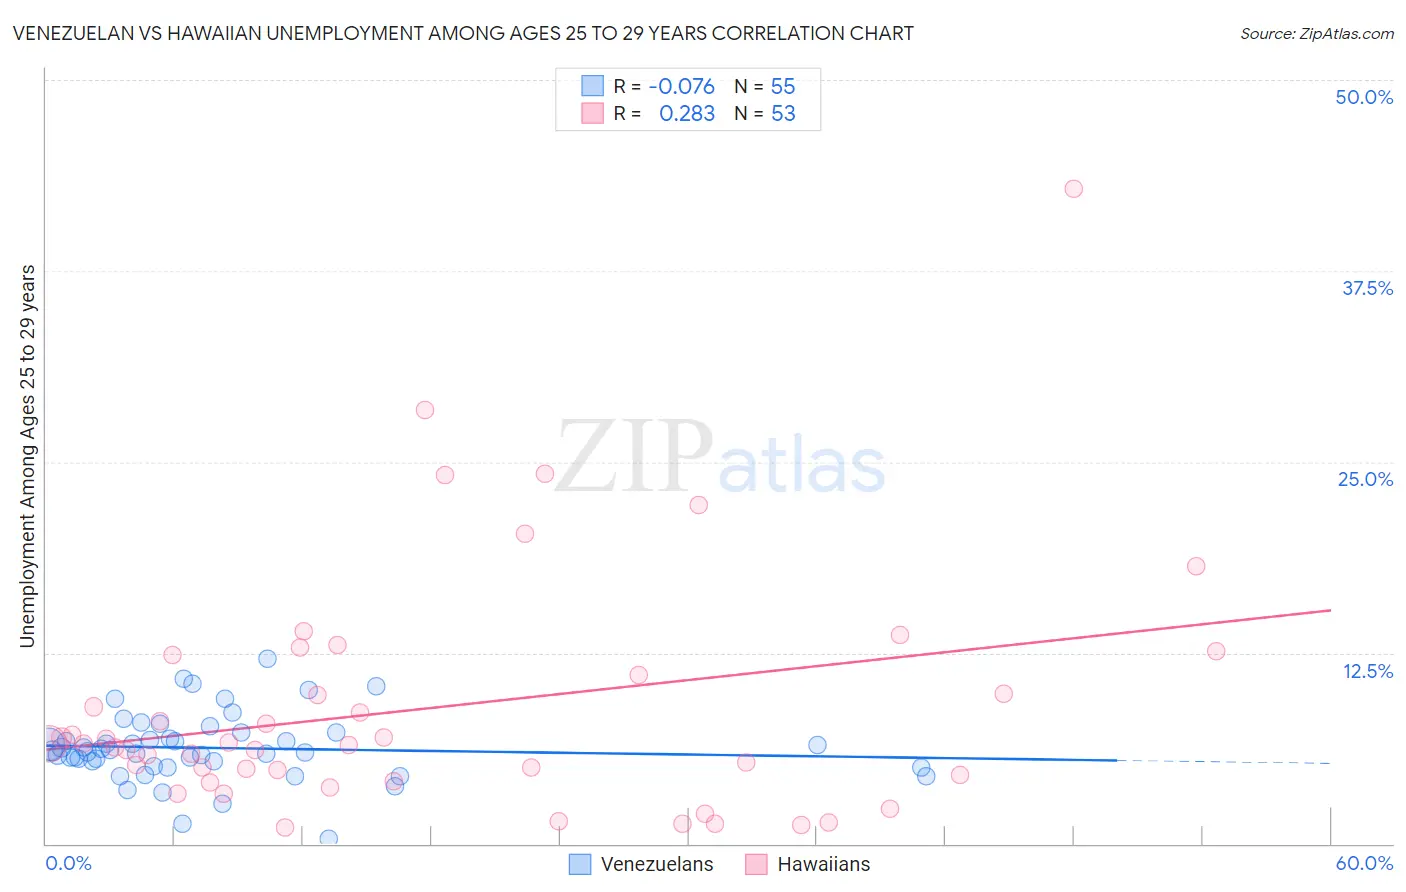
Venezuelan vs Hawaiian Unemployment Among Ages 25 to 29 years Correlation Chart
The statistical analysis conducted on geographies consisting of 296,350,237 people shows a slight negative correlation between the proportion of Venezuelans and unemployment rate among population between the ages 25 and 29 in the United States with a correlation coefficient (R) of -0.076 and weighted average of 6.2%. Similarly, the statistical analysis conducted on geographies consisting of 314,743,173 people shows a weak positive correlation between the proportion of Hawaiians and unemployment rate among population between the ages 25 and 29 in the United States with a correlation coefficient (R) of 0.283 and weighted average of 6.8%, a difference of 10.3%.
Unemployment Among Ages 25 to 29 years Correlation Summary
| Measurement | Venezuelan | Hawaiian |
| Minimum | 0.30% | 1.1% |
| Maximum | 12.1% | 42.9% |
| Range | 11.8% | 41.8% |
| Mean | 6.3% | 8.9% |
| Median | 6.1% | 6.5% |
| Interquartile 25% (IQ1) | 5.1% | 4.3% |
| Interquartile 75% (IQ3) | 7.3% | 11.7% |
| Interquartile Range (IQR) | 2.2% | 7.4% |
| Standard Deviation (Sample) | 2.2% | 7.9% |
| Standard Deviation (Population) | 2.2% | 7.9% |
Similar Demographics by Unemployment Among Ages 25 to 29 years
Demographics Similar to Venezuelans by Unemployment Among Ages 25 to 29 years
In terms of unemployment among ages 25 to 29 years, the demographic groups most similar to Venezuelans are Immigrants from Lithuania (6.2%, a difference of 0.080%), Latvian (6.2%, a difference of 0.10%), Immigrants from Australia (6.2%, a difference of 0.11%), German Russian (6.2%, a difference of 0.18%), and Mongolian (6.2%, a difference of 0.20%).
| Demographics | Rating | Rank | Unemployment Among Ages 25 to 29 years |
| Ethiopians | 99.4 /100 | #38 | Exceptional 6.1% |
| Indonesians | 99.3 /100 | #39 | Exceptional 6.1% |
| Immigrants | Kenya | 99.3 /100 | #40 | Exceptional 6.1% |
| Fijians | 99.3 /100 | #41 | Exceptional 6.1% |
| Jordanians | 99.3 /100 | #42 | Exceptional 6.1% |
| Czechs | 99.2 /100 | #43 | Exceptional 6.2% |
| Mongolians | 99.2 /100 | #44 | Exceptional 6.2% |
| Venezuelans | 99.1 /100 | #45 | Exceptional 6.2% |
| Immigrants | Lithuania | 99.0 /100 | #46 | Exceptional 6.2% |
| Latvians | 99.0 /100 | #47 | Exceptional 6.2% |
| Immigrants | Australia | 99.0 /100 | #48 | Exceptional 6.2% |
| German Russians | 99.0 /100 | #49 | Exceptional 6.2% |
| Soviet Union | 98.9 /100 | #50 | Exceptional 6.2% |
| Burmese | 98.9 /100 | #51 | Exceptional 6.2% |
| Immigrants | Turkey | 98.9 /100 | #52 | Exceptional 6.2% |
Demographics Similar to Hawaiians by Unemployment Among Ages 25 to 29 years
In terms of unemployment among ages 25 to 29 years, the demographic groups most similar to Hawaiians are Canadian (6.8%, a difference of 0.020%), Immigrants from Philippines (6.8%, a difference of 0.050%), Immigrants from Cabo Verde (6.8%, a difference of 0.10%), Immigrants from Germany (6.8%, a difference of 0.18%), and Immigrants from Denmark (6.8%, a difference of 0.20%).
| Demographics | Rating | Rank | Unemployment Among Ages 25 to 29 years |
| Immigrants | Argentina | 21.6 /100 | #202 | Fair 6.8% |
| Immigrants | Norway | 21.2 /100 | #203 | Fair 6.8% |
| Scotch-Irish | 20.0 /100 | #204 | Poor 6.8% |
| Immigrants | England | 19.8 /100 | #205 | Poor 6.8% |
| Ugandans | 19.8 /100 | #206 | Poor 6.8% |
| Immigrants | Denmark | 19.0 /100 | #207 | Poor 6.8% |
| Immigrants | Germany | 18.8 /100 | #208 | Poor 6.8% |
| Hawaiians | 17.1 /100 | #209 | Poor 6.8% |
| Canadians | 16.9 /100 | #210 | Poor 6.8% |
| Immigrants | Philippines | 16.7 /100 | #211 | Poor 6.8% |
| Immigrants | Cabo Verde | 16.2 /100 | #212 | Poor 6.8% |
| Immigrants | Syria | 15.1 /100 | #213 | Poor 6.8% |
| Liberians | 14.7 /100 | #214 | Poor 6.8% |
| Spanish | 14.4 /100 | #215 | Poor 6.8% |
| Slovaks | 14.3 /100 | #216 | Poor 6.8% |