Ute vs Immigrants from Lithuania In Labor Force | Age 45-54
COMPARE
Ute
Immigrants from Lithuania
In Labor Force | Age 45-54
In Labor Force | Age 45-54 Comparison
Ute
Immigrants from Lithuania
76.6%
IN LABOR FORCE | AGE 45-54
0.0/ 100
METRIC RATING
337th/ 347
METRIC RANK
83.9%
IN LABOR FORCE | AGE 45-54
99.8/ 100
METRIC RATING
28th/ 347
METRIC RANK
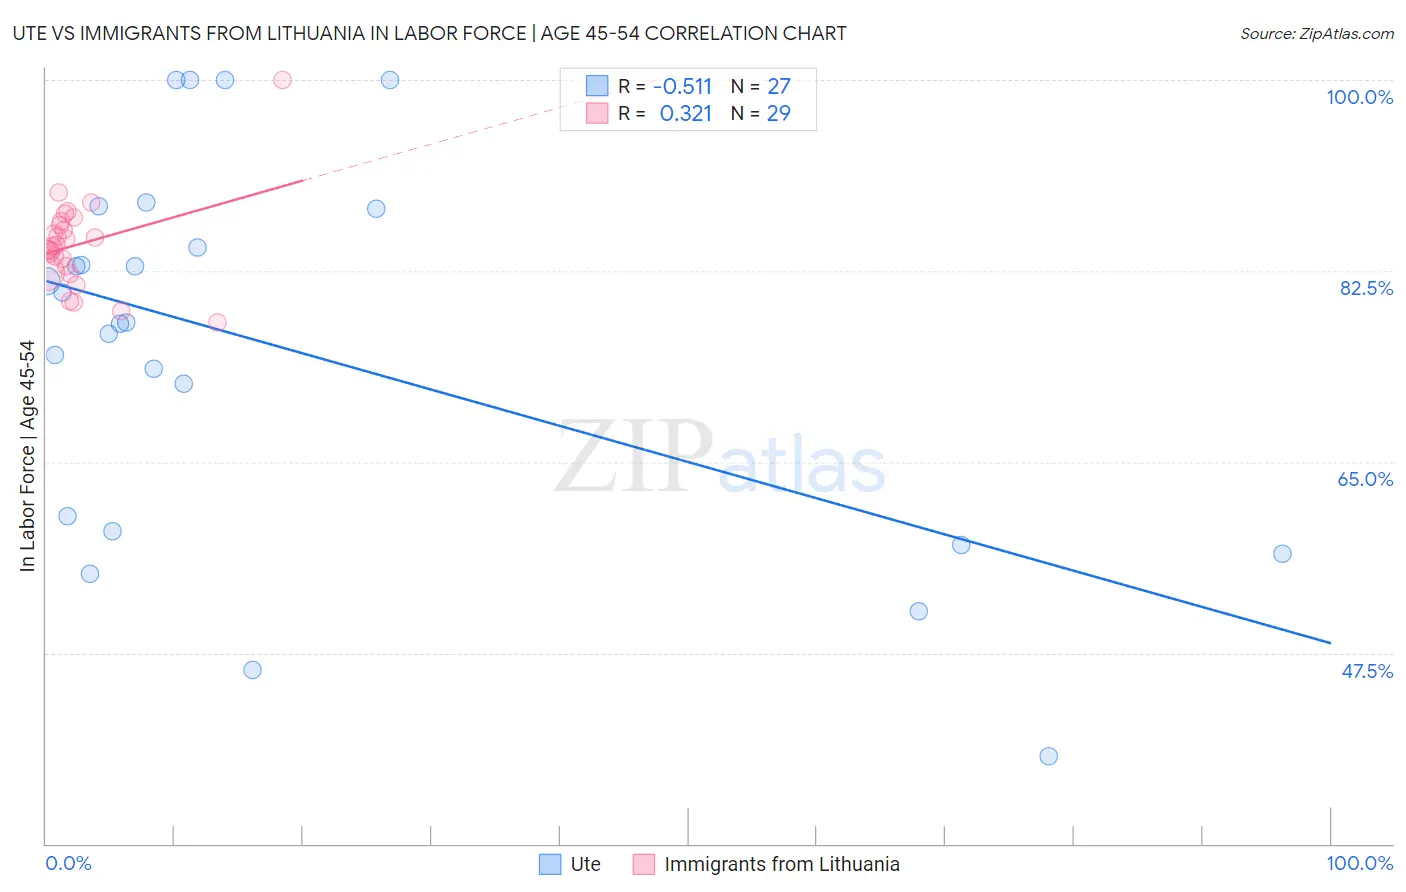
Ute vs Immigrants from Lithuania In Labor Force | Age 45-54 Correlation Chart
The statistical analysis conducted on geographies consisting of 55,657,904 people shows a substantial negative correlation between the proportion of Ute and labor force participation rate among population between the ages 45 and 54 in the United States with a correlation coefficient (R) of -0.511 and weighted average of 76.6%. Similarly, the statistical analysis conducted on geographies consisting of 117,719,055 people shows a mild positive correlation between the proportion of Immigrants from Lithuania and labor force participation rate among population between the ages 45 and 54 in the United States with a correlation coefficient (R) of 0.321 and weighted average of 83.9%, a difference of 9.5%.
In Labor Force | Age 45-54 Correlation Summary
| Measurement | Ute | Immigrants from Lithuania |
| Minimum | 38.0% | 77.8% |
| Maximum | 100.0% | 100.0% |
| Range | 62.0% | 22.2% |
| Mean | 75.4% | 84.9% |
| Median | 77.8% | 84.8% |
| Interquartile 25% (IQ1) | 58.6% | 82.7% |
| Interquartile 75% (IQ3) | 88.2% | 86.9% |
| Interquartile Range (IQR) | 29.6% | 4.2% |
| Standard Deviation (Sample) | 17.3% | 4.1% |
| Standard Deviation (Population) | 16.9% | 4.1% |
Similar Demographics by In Labor Force | Age 45-54
Demographics Similar to Ute by In Labor Force | Age 45-54
In terms of in labor force | age 45-54, the demographic groups most similar to Ute are Paiute (76.7%, a difference of 0.060%), Yuman (76.3%, a difference of 0.41%), Arapaho (77.1%, a difference of 0.60%), Native/Alaskan (77.1%, a difference of 0.67%), and Apache (77.1%, a difference of 0.67%).
| Demographics | Rating | Rank | In Labor Force | Age 45-54 |
| Cheyenne | 0.0 /100 | #330 | Tragic 77.6% |
| Tsimshian | 0.0 /100 | #331 | Tragic 77.4% |
| Menominee | 0.0 /100 | #332 | Tragic 77.4% |
| Natives/Alaskans | 0.0 /100 | #333 | Tragic 77.1% |
| Apache | 0.0 /100 | #334 | Tragic 77.1% |
| Arapaho | 0.0 /100 | #335 | Tragic 77.1% |
| Paiute | 0.0 /100 | #336 | Tragic 76.7% |
| Ute | 0.0 /100 | #337 | Tragic 76.6% |
| Yuman | 0.0 /100 | #338 | Tragic 76.3% |
| Puerto Ricans | 0.0 /100 | #339 | Tragic 75.9% |
| Lumbee | 0.0 /100 | #340 | Tragic 75.6% |
| Pueblo | 0.0 /100 | #341 | Tragic 75.5% |
| Tohono O'odham | 0.0 /100 | #342 | Tragic 75.1% |
| Hopi | 0.0 /100 | #343 | Tragic 75.0% |
| Immigrants | Yemen | 0.0 /100 | #344 | Tragic 74.4% |
Demographics Similar to Immigrants from Lithuania by In Labor Force | Age 45-54
In terms of in labor force | age 45-54, the demographic groups most similar to Immigrants from Lithuania are Immigrants from Brazil (83.9%, a difference of 0.010%), Immigrants from Serbia (83.9%, a difference of 0.020%), Immigrants from Pakistan (83.8%, a difference of 0.020%), Immigrants from North Macedonia (83.9%, a difference of 0.030%), and Immigrants from Bulgaria (83.8%, a difference of 0.040%).
| Demographics | Rating | Rank | In Labor Force | Age 45-54 |
| Immigrants | Sri Lanka | 99.8 /100 | #21 | Exceptional 83.9% |
| Immigrants | Ireland | 99.8 /100 | #22 | Exceptional 83.9% |
| Tlingit-Haida | 99.8 /100 | #23 | Exceptional 83.9% |
| Slovenes | 99.8 /100 | #24 | Exceptional 83.9% |
| Immigrants | North Macedonia | 99.8 /100 | #25 | Exceptional 83.9% |
| Immigrants | Serbia | 99.8 /100 | #26 | Exceptional 83.9% |
| Immigrants | Brazil | 99.8 /100 | #27 | Exceptional 83.9% |
| Immigrants | Lithuania | 99.8 /100 | #28 | Exceptional 83.9% |
| Immigrants | Pakistan | 99.7 /100 | #29 | Exceptional 83.8% |
| Immigrants | Bulgaria | 99.7 /100 | #30 | Exceptional 83.8% |
| Immigrants | Eritrea | 99.7 /100 | #31 | Exceptional 83.8% |
| Turks | 99.7 /100 | #32 | Exceptional 83.8% |
| Latvians | 99.7 /100 | #33 | Exceptional 83.8% |
| Kenyans | 99.5 /100 | #34 | Exceptional 83.7% |
| Brazilians | 99.5 /100 | #35 | Exceptional 83.7% |