Immigrants from Morocco vs Immigrants from Lithuania In Labor Force | Age 45-54
COMPARE
Immigrants from Morocco
Immigrants from Lithuania
In Labor Force | Age 45-54
In Labor Force | Age 45-54 Comparison
Immigrants from Morocco
Immigrants from Lithuania
83.6%
IN LABOR FORCE | AGE 45-54
99.0/ 100
METRIC RATING
49th/ 347
METRIC RANK
83.9%
IN LABOR FORCE | AGE 45-54
99.8/ 100
METRIC RATING
28th/ 347
METRIC RANK
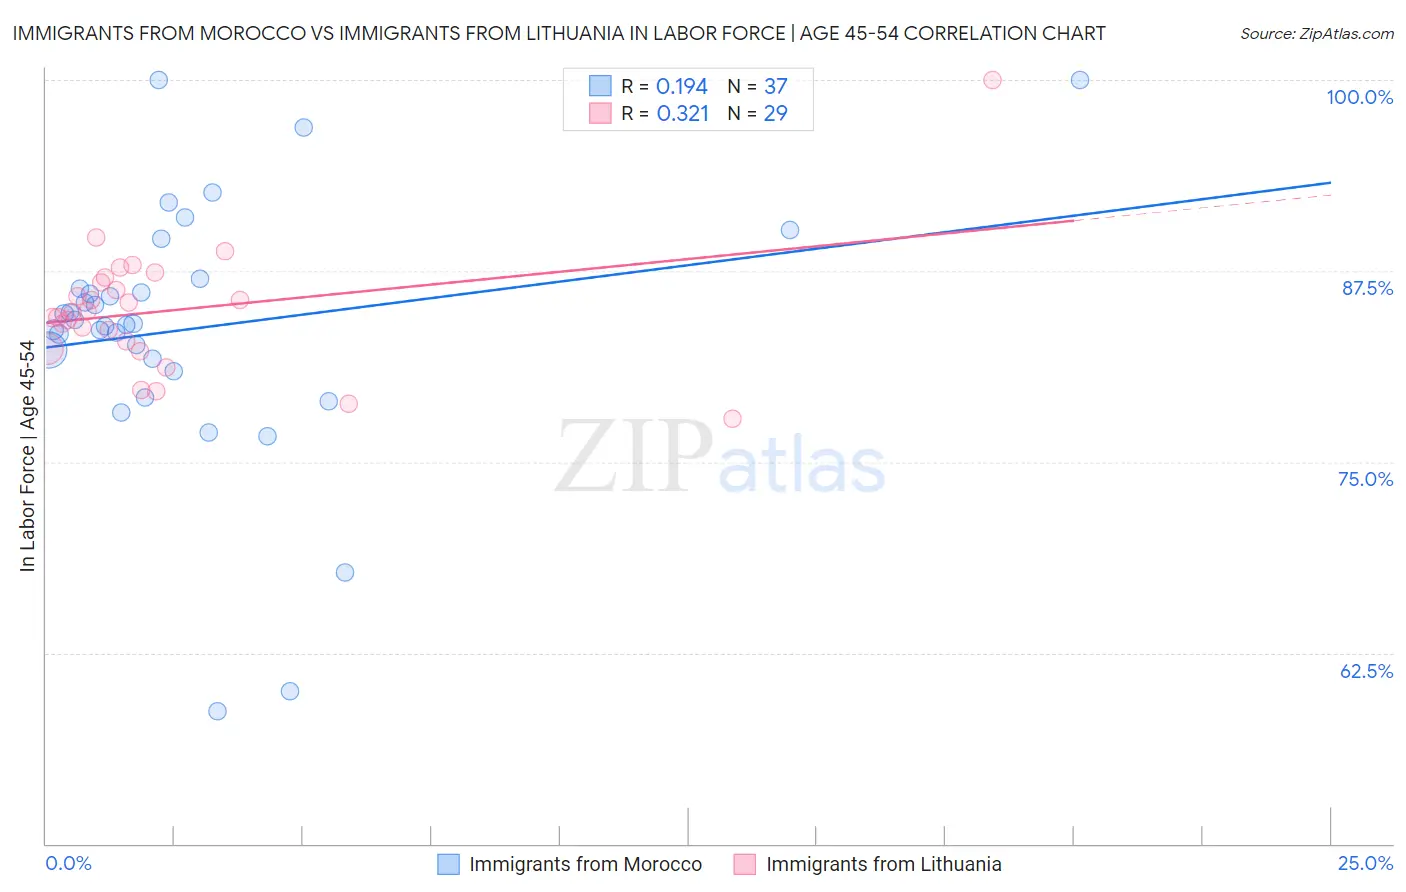
Immigrants from Morocco vs Immigrants from Lithuania In Labor Force | Age 45-54 Correlation Chart
The statistical analysis conducted on geographies consisting of 178,909,930 people shows a poor positive correlation between the proportion of Immigrants from Morocco and labor force participation rate among population between the ages 45 and 54 in the United States with a correlation coefficient (R) of 0.194 and weighted average of 83.6%. Similarly, the statistical analysis conducted on geographies consisting of 117,719,055 people shows a mild positive correlation between the proportion of Immigrants from Lithuania and labor force participation rate among population between the ages 45 and 54 in the United States with a correlation coefficient (R) of 0.321 and weighted average of 83.9%, a difference of 0.33%.
In Labor Force | Age 45-54 Correlation Summary
| Measurement | Immigrants from Morocco | Immigrants from Lithuania |
| Minimum | 58.7% | 77.8% |
| Maximum | 100.0% | 100.0% |
| Range | 41.3% | 22.2% |
| Mean | 83.7% | 84.9% |
| Median | 84.0% | 84.8% |
| Interquartile 25% (IQ1) | 81.3% | 82.7% |
| Interquartile 75% (IQ3) | 86.7% | 86.9% |
| Interquartile Range (IQR) | 5.4% | 4.2% |
| Standard Deviation (Sample) | 8.6% | 4.1% |
| Standard Deviation (Population) | 8.5% | 4.1% |
Similar Demographics by In Labor Force | Age 45-54
Demographics Similar to Immigrants from Morocco by In Labor Force | Age 45-54
In terms of in labor force | age 45-54, the demographic groups most similar to Immigrants from Morocco are Immigrants from Poland (83.6%, a difference of 0.0%), Croatian (83.6%, a difference of 0.010%), Lithuanian (83.6%, a difference of 0.020%), Burmese (83.6%, a difference of 0.030%), and Immigrants from Hong Kong (83.6%, a difference of 0.030%).
| Demographics | Rating | Rank | In Labor Force | Age 45-54 |
| Immigrants | Moldova | 99.3 /100 | #42 | Exceptional 83.7% |
| Venezuelans | 99.2 /100 | #43 | Exceptional 83.6% |
| Burmese | 99.1 /100 | #44 | Exceptional 83.6% |
| Immigrants | Hong Kong | 99.1 /100 | #45 | Exceptional 83.6% |
| Lithuanians | 99.1 /100 | #46 | Exceptional 83.6% |
| Croatians | 99.0 /100 | #47 | Exceptional 83.6% |
| Immigrants | Poland | 99.0 /100 | #48 | Exceptional 83.6% |
| Immigrants | Morocco | 99.0 /100 | #49 | Exceptional 83.6% |
| Immigrants | Greece | 98.8 /100 | #50 | Exceptional 83.6% |
| Immigrants | Turkey | 98.8 /100 | #51 | Exceptional 83.6% |
| Poles | 98.7 /100 | #52 | Exceptional 83.6% |
| Peruvians | 98.7 /100 | #53 | Exceptional 83.6% |
| Somalis | 98.7 /100 | #54 | Exceptional 83.5% |
| Macedonians | 98.7 /100 | #55 | Exceptional 83.5% |
| Immigrants | Peru | 98.6 /100 | #56 | Exceptional 83.5% |
Demographics Similar to Immigrants from Lithuania by In Labor Force | Age 45-54
In terms of in labor force | age 45-54, the demographic groups most similar to Immigrants from Lithuania are Immigrants from Brazil (83.9%, a difference of 0.010%), Immigrants from Serbia (83.9%, a difference of 0.020%), Immigrants from Pakistan (83.8%, a difference of 0.020%), Immigrants from North Macedonia (83.9%, a difference of 0.030%), and Immigrants from Bulgaria (83.8%, a difference of 0.040%).
| Demographics | Rating | Rank | In Labor Force | Age 45-54 |
| Immigrants | Sri Lanka | 99.8 /100 | #21 | Exceptional 83.9% |
| Immigrants | Ireland | 99.8 /100 | #22 | Exceptional 83.9% |
| Tlingit-Haida | 99.8 /100 | #23 | Exceptional 83.9% |
| Slovenes | 99.8 /100 | #24 | Exceptional 83.9% |
| Immigrants | North Macedonia | 99.8 /100 | #25 | Exceptional 83.9% |
| Immigrants | Serbia | 99.8 /100 | #26 | Exceptional 83.9% |
| Immigrants | Brazil | 99.8 /100 | #27 | Exceptional 83.9% |
| Immigrants | Lithuania | 99.8 /100 | #28 | Exceptional 83.9% |
| Immigrants | Pakistan | 99.7 /100 | #29 | Exceptional 83.8% |
| Immigrants | Bulgaria | 99.7 /100 | #30 | Exceptional 83.8% |
| Immigrants | Eritrea | 99.7 /100 | #31 | Exceptional 83.8% |
| Turks | 99.7 /100 | #32 | Exceptional 83.8% |
| Latvians | 99.7 /100 | #33 | Exceptional 83.8% |
| Kenyans | 99.5 /100 | #34 | Exceptional 83.7% |
| Brazilians | 99.5 /100 | #35 | Exceptional 83.7% |