Ute vs Immigrants from Sierra Leone In Labor Force | Age 45-54
COMPARE
Ute
Immigrants from Sierra Leone
In Labor Force | Age 45-54
In Labor Force | Age 45-54 Comparison
Ute
Immigrants from Sierra Leone
76.6%
IN LABOR FORCE | AGE 45-54
0.0/ 100
METRIC RATING
337th/ 347
METRIC RANK
84.4%
IN LABOR FORCE | AGE 45-54
100.0/ 100
METRIC RATING
9th/ 347
METRIC RANK
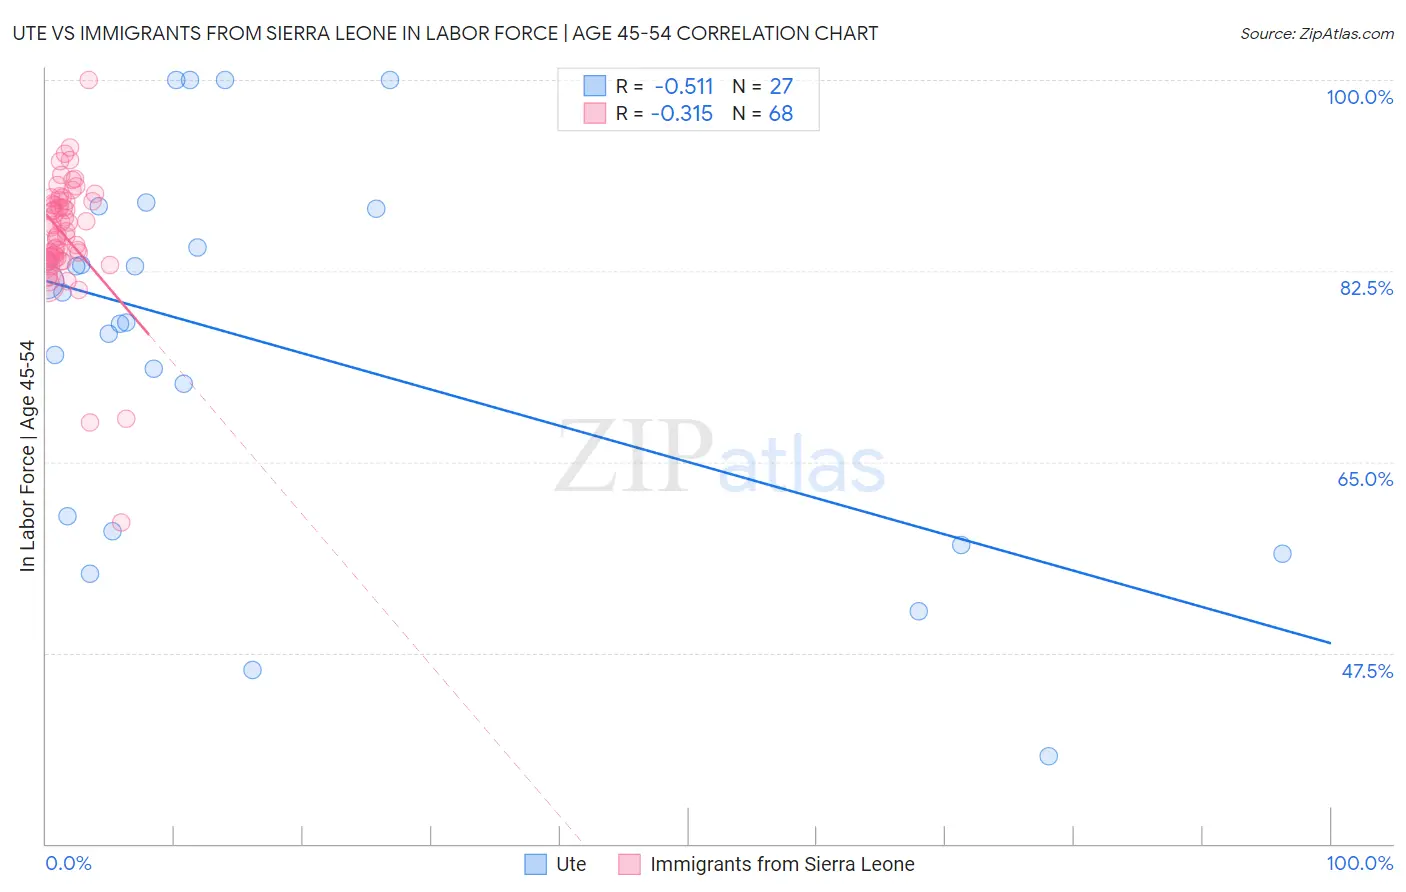
Ute vs Immigrants from Sierra Leone In Labor Force | Age 45-54 Correlation Chart
The statistical analysis conducted on geographies consisting of 55,657,904 people shows a substantial negative correlation between the proportion of Ute and labor force participation rate among population between the ages 45 and 54 in the United States with a correlation coefficient (R) of -0.511 and weighted average of 76.6%. Similarly, the statistical analysis conducted on geographies consisting of 101,646,283 people shows a mild negative correlation between the proportion of Immigrants from Sierra Leone and labor force participation rate among population between the ages 45 and 54 in the United States with a correlation coefficient (R) of -0.315 and weighted average of 84.4%, a difference of 10.2%.
In Labor Force | Age 45-54 Correlation Summary
| Measurement | Ute | Immigrants from Sierra Leone |
| Minimum | 38.0% | 59.4% |
| Maximum | 100.0% | 100.0% |
| Range | 62.0% | 40.6% |
| Mean | 75.4% | 85.7% |
| Median | 77.8% | 85.9% |
| Interquartile 25% (IQ1) | 58.6% | 83.5% |
| Interquartile 75% (IQ3) | 88.2% | 88.9% |
| Interquartile Range (IQR) | 29.6% | 5.4% |
| Standard Deviation (Sample) | 17.3% | 5.7% |
| Standard Deviation (Population) | 16.9% | 5.6% |
Similar Demographics by In Labor Force | Age 45-54
Demographics Similar to Ute by In Labor Force | Age 45-54
In terms of in labor force | age 45-54, the demographic groups most similar to Ute are Paiute (76.7%, a difference of 0.060%), Yuman (76.3%, a difference of 0.41%), Arapaho (77.1%, a difference of 0.60%), Native/Alaskan (77.1%, a difference of 0.67%), and Apache (77.1%, a difference of 0.67%).
| Demographics | Rating | Rank | In Labor Force | Age 45-54 |
| Cheyenne | 0.0 /100 | #330 | Tragic 77.6% |
| Tsimshian | 0.0 /100 | #331 | Tragic 77.4% |
| Menominee | 0.0 /100 | #332 | Tragic 77.4% |
| Natives/Alaskans | 0.0 /100 | #333 | Tragic 77.1% |
| Apache | 0.0 /100 | #334 | Tragic 77.1% |
| Arapaho | 0.0 /100 | #335 | Tragic 77.1% |
| Paiute | 0.0 /100 | #336 | Tragic 76.7% |
| Ute | 0.0 /100 | #337 | Tragic 76.6% |
| Yuman | 0.0 /100 | #338 | Tragic 76.3% |
| Puerto Ricans | 0.0 /100 | #339 | Tragic 75.9% |
| Lumbee | 0.0 /100 | #340 | Tragic 75.6% |
| Pueblo | 0.0 /100 | #341 | Tragic 75.5% |
| Tohono O'odham | 0.0 /100 | #342 | Tragic 75.1% |
| Hopi | 0.0 /100 | #343 | Tragic 75.0% |
| Immigrants | Yemen | 0.0 /100 | #344 | Tragic 74.4% |
Demographics Similar to Immigrants from Sierra Leone by In Labor Force | Age 45-54
In terms of in labor force | age 45-54, the demographic groups most similar to Immigrants from Sierra Leone are Norwegian (84.4%, a difference of 0.020%), Sierra Leonean (84.5%, a difference of 0.11%), Thai (84.3%, a difference of 0.11%), Immigrants from Cameroon (84.6%, a difference of 0.22%), and Bulgarian (84.2%, a difference of 0.22%).
| Demographics | Rating | Rank | In Labor Force | Age 45-54 |
| Luxembourgers | 100.0 /100 | #2 | Exceptional 85.0% |
| Bolivians | 100.0 /100 | #3 | Exceptional 84.9% |
| Immigrants | Ethiopia | 100.0 /100 | #4 | Exceptional 84.8% |
| Ethiopians | 100.0 /100 | #5 | Exceptional 84.8% |
| Immigrants | India | 100.0 /100 | #6 | Exceptional 84.7% |
| Immigrants | Cameroon | 100.0 /100 | #7 | Exceptional 84.6% |
| Sierra Leoneans | 100.0 /100 | #8 | Exceptional 84.5% |
| Immigrants | Sierra Leone | 100.0 /100 | #9 | Exceptional 84.4% |
| Norwegians | 100.0 /100 | #10 | Exceptional 84.4% |
| Thais | 100.0 /100 | #11 | Exceptional 84.3% |
| Bulgarians | 100.0 /100 | #12 | Exceptional 84.2% |
| Chinese | 99.9 /100 | #13 | Exceptional 84.1% |
| Cambodians | 99.9 /100 | #14 | Exceptional 84.1% |
| Cypriots | 99.9 /100 | #15 | Exceptional 84.1% |
| Immigrants | Nepal | 99.9 /100 | #16 | Exceptional 84.0% |