Ute vs Immigrants from Lithuania Family Households with Children
COMPARE
Ute
Immigrants from Lithuania
Family Households with Children
Family Households with Children Comparison
Ute
Immigrants from Lithuania
28.2%
FAMILY HOUSEHOLDS WITH CHILDREN
99.1/ 100
METRIC RATING
96th/ 347
METRIC RANK
26.8%
FAMILY HOUSEHOLDS WITH CHILDREN
1.2/ 100
METRIC RATING
259th/ 347
METRIC RANK
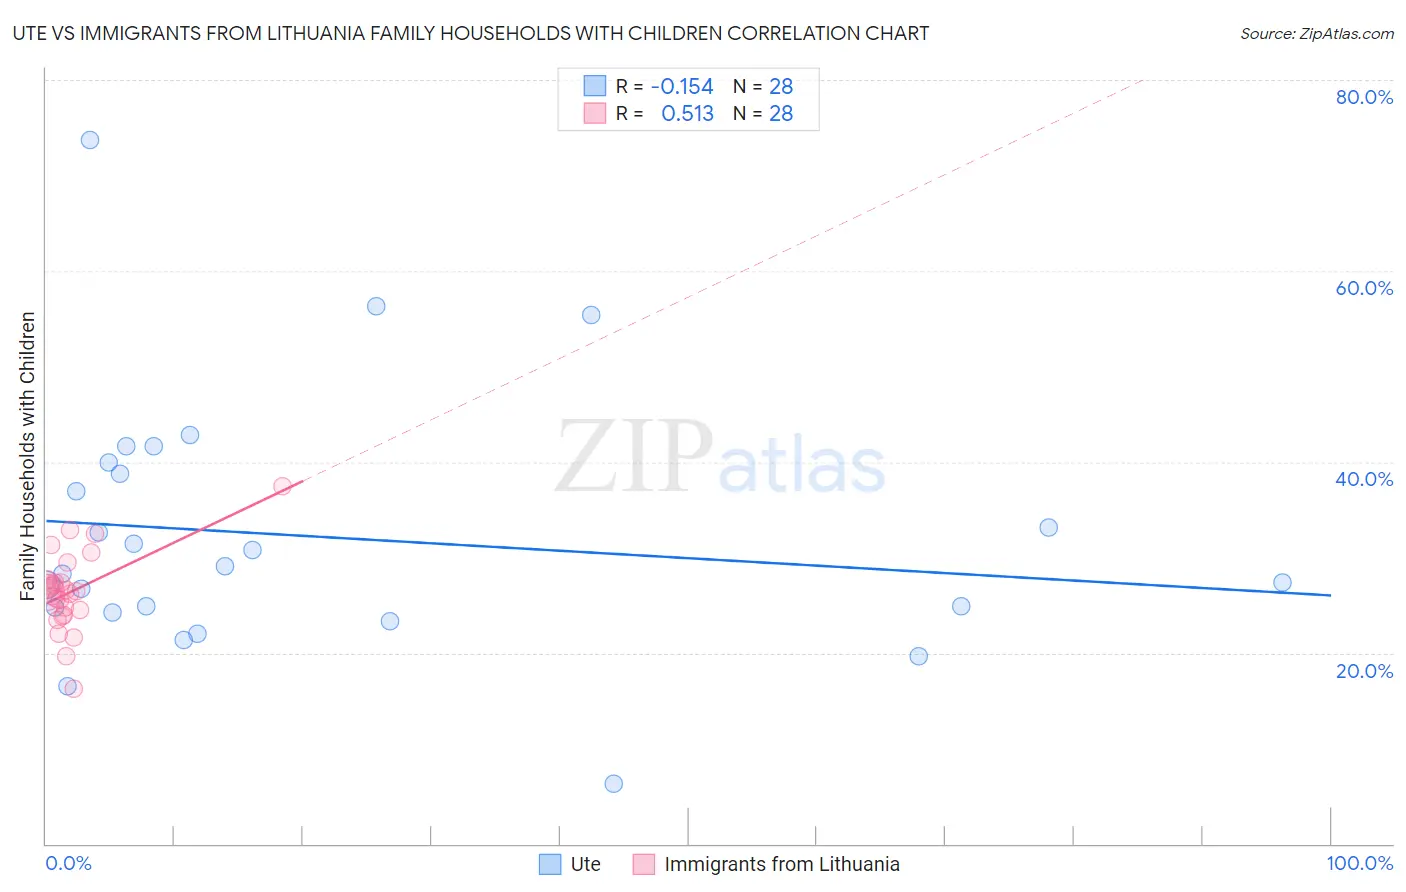
Ute vs Immigrants from Lithuania Family Households with Children Correlation Chart
The statistical analysis conducted on geographies consisting of 55,657,508 people shows a poor negative correlation between the proportion of Ute and percentage of family households with children in the United States with a correlation coefficient (R) of -0.154 and weighted average of 28.2%. Similarly, the statistical analysis conducted on geographies consisting of 117,683,202 people shows a substantial positive correlation between the proportion of Immigrants from Lithuania and percentage of family households with children in the United States with a correlation coefficient (R) of 0.513 and weighted average of 26.8%, a difference of 5.1%.
Family Households with Children Correlation Summary
| Measurement | Ute | Immigrants from Lithuania |
| Minimum | 6.3% | 16.2% |
| Maximum | 73.7% | 37.4% |
| Range | 67.4% | 21.2% |
| Mean | 32.2% | 26.4% |
| Median | 28.7% | 26.4% |
| Interquartile 25% (IQ1) | 24.5% | 24.3% |
| Interquartile 75% (IQ3) | 39.3% | 27.5% |
| Interquartile Range (IQR) | 14.9% | 3.3% |
| Standard Deviation (Sample) | 13.6% | 4.2% |
| Standard Deviation (Population) | 13.3% | 4.1% |
Similar Demographics by Family Households with Children
Demographics Similar to Ute by Family Households with Children
In terms of family households with children, the demographic groups most similar to Ute are Immigrants from Nicaragua (28.2%, a difference of 0.020%), Chilean (28.1%, a difference of 0.060%), Immigrants from Colombia (28.2%, a difference of 0.090%), Immigrants from Kenya (28.1%, a difference of 0.10%), and Immigrants from the Azores (28.1%, a difference of 0.11%).
| Demographics | Rating | Rank | Family Households with Children |
| Immigrants | Costa Rica | 99.6 /100 | #89 | Exceptional 28.3% |
| Immigrants | Thailand | 99.5 /100 | #90 | Exceptional 28.2% |
| Immigrants | Liberia | 99.4 /100 | #91 | Exceptional 28.2% |
| Chickasaw | 99.4 /100 | #92 | Exceptional 28.2% |
| Panamanians | 99.3 /100 | #93 | Exceptional 28.2% |
| Immigrants | Colombia | 99.2 /100 | #94 | Exceptional 28.2% |
| Immigrants | Nicaragua | 99.1 /100 | #95 | Exceptional 28.2% |
| Ute | 99.1 /100 | #96 | Exceptional 28.2% |
| Chileans | 98.9 /100 | #97 | Exceptional 28.1% |
| Immigrants | Kenya | 98.9 /100 | #98 | Exceptional 28.1% |
| Immigrants | Azores | 98.8 /100 | #99 | Exceptional 28.1% |
| Indonesians | 98.8 /100 | #100 | Exceptional 28.1% |
| Immigrants | Oceania | 98.8 /100 | #101 | Exceptional 28.1% |
| Assyrians/Chaldeans/Syriacs | 98.7 /100 | #102 | Exceptional 28.1% |
| Palestinians | 98.5 /100 | #103 | Exceptional 28.1% |
Demographics Similar to Immigrants from Lithuania by Family Households with Children
In terms of family households with children, the demographic groups most similar to Immigrants from Lithuania are Immigrants from Jamaica (26.8%, a difference of 0.020%), Immigrants from Cuba (26.8%, a difference of 0.030%), Slavic (26.8%, a difference of 0.040%), Immigrants from Belarus (26.8%, a difference of 0.070%), and Scotch-Irish (26.8%, a difference of 0.080%).
| Demographics | Rating | Rank | Family Households with Children |
| Irish | 1.8 /100 | #252 | Tragic 26.8% |
| Italians | 1.5 /100 | #253 | Tragic 26.8% |
| Immigrants | Scotland | 1.5 /100 | #254 | Tragic 26.8% |
| German Russians | 1.5 /100 | #255 | Tragic 26.8% |
| Scotch-Irish | 1.4 /100 | #256 | Tragic 26.8% |
| Slavs | 1.3 /100 | #257 | Tragic 26.8% |
| Immigrants | Cuba | 1.3 /100 | #258 | Tragic 26.8% |
| Immigrants | Lithuania | 1.2 /100 | #259 | Tragic 26.8% |
| Immigrants | Jamaica | 1.2 /100 | #260 | Tragic 26.8% |
| Immigrants | Belarus | 1.1 /100 | #261 | Tragic 26.8% |
| Immigrants | Russia | 1.0 /100 | #262 | Tragic 26.8% |
| Immigrants | North Macedonia | 1.0 /100 | #263 | Tragic 26.7% |
| Taiwanese | 0.9 /100 | #264 | Tragic 26.7% |
| Chippewa | 0.9 /100 | #265 | Tragic 26.7% |
| Maltese | 0.9 /100 | #266 | Tragic 26.7% |