Pennsylvania German vs Immigrants from Lithuania In Labor Force | Age 45-54
COMPARE
Pennsylvania German
Immigrants from Lithuania
In Labor Force | Age 45-54
In Labor Force | Age 45-54 Comparison
Pennsylvania Germans
Immigrants from Lithuania
81.6%
IN LABOR FORCE | AGE 45-54
0.2/ 100
METRIC RATING
252nd/ 347
METRIC RANK
83.9%
IN LABOR FORCE | AGE 45-54
99.8/ 100
METRIC RATING
28th/ 347
METRIC RANK
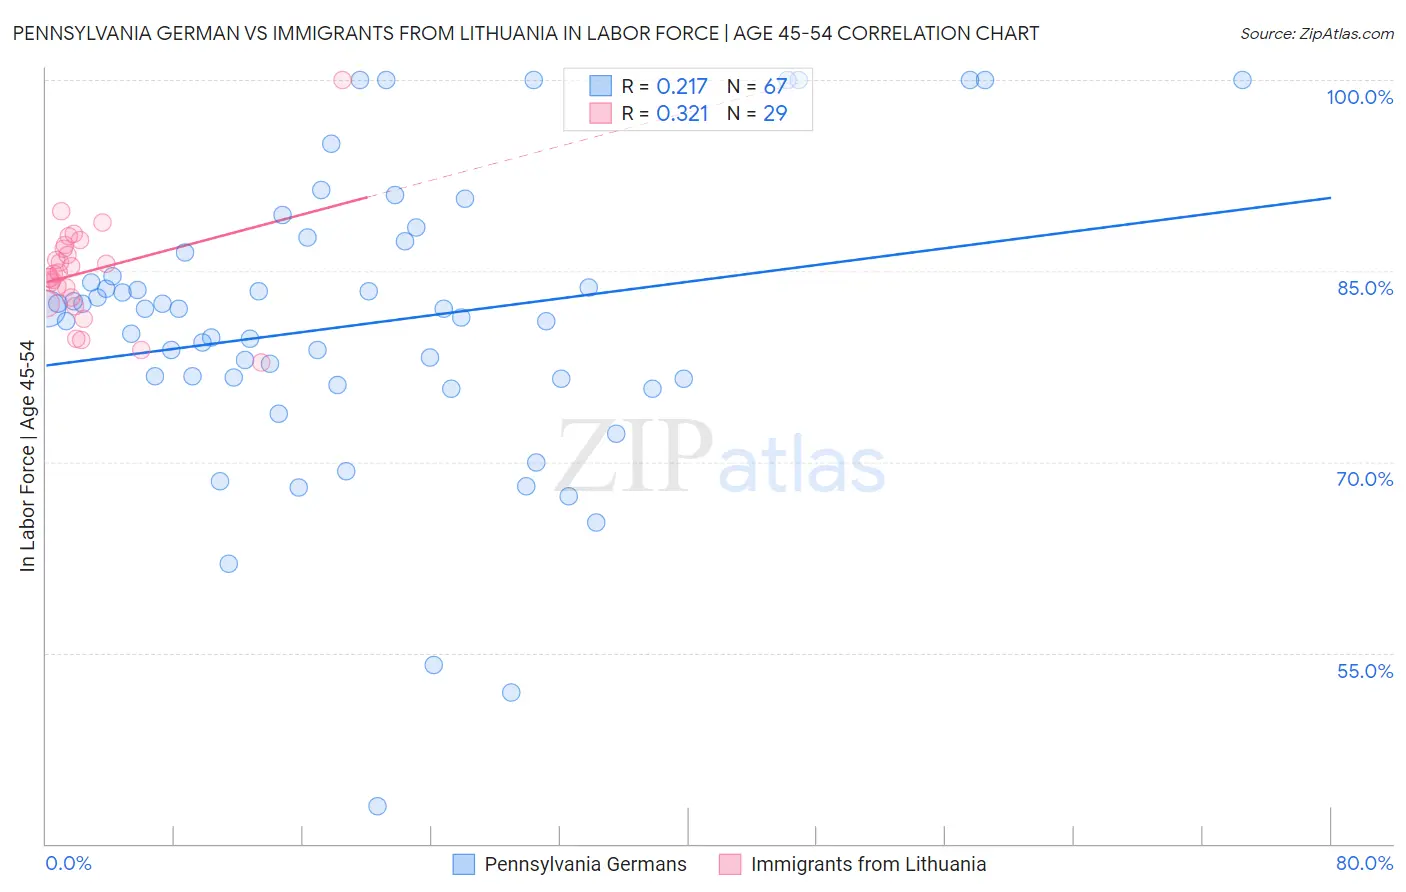
Pennsylvania German vs Immigrants from Lithuania In Labor Force | Age 45-54 Correlation Chart
The statistical analysis conducted on geographies consisting of 234,049,036 people shows a weak positive correlation between the proportion of Pennsylvania Germans and labor force participation rate among population between the ages 45 and 54 in the United States with a correlation coefficient (R) of 0.217 and weighted average of 81.6%. Similarly, the statistical analysis conducted on geographies consisting of 117,719,055 people shows a mild positive correlation between the proportion of Immigrants from Lithuania and labor force participation rate among population between the ages 45 and 54 in the United States with a correlation coefficient (R) of 0.321 and weighted average of 83.9%, a difference of 2.7%.
In Labor Force | Age 45-54 Correlation Summary
| Measurement | Pennsylvania German | Immigrants from Lithuania |
| Minimum | 42.9% | 77.8% |
| Maximum | 100.0% | 100.0% |
| Range | 57.1% | 22.2% |
| Mean | 80.8% | 84.9% |
| Median | 82.0% | 84.8% |
| Interquartile 25% (IQ1) | 76.5% | 82.7% |
| Interquartile 75% (IQ3) | 86.5% | 86.9% |
| Interquartile Range (IQR) | 10.0% | 4.2% |
| Standard Deviation (Sample) | 11.4% | 4.1% |
| Standard Deviation (Population) | 11.3% | 4.1% |
Similar Demographics by In Labor Force | Age 45-54
Demographics Similar to Pennsylvania Germans by In Labor Force | Age 45-54
In terms of in labor force | age 45-54, the demographic groups most similar to Pennsylvania Germans are Guamanian/Chamorro (81.6%, a difference of 0.020%), Japanese (81.6%, a difference of 0.030%), Immigrants from Laos (81.6%, a difference of 0.030%), Immigrants from Armenia (81.7%, a difference of 0.040%), and Scotch-Irish (81.6%, a difference of 0.050%).
| Demographics | Rating | Rank | In Labor Force | Age 45-54 |
| Alaska Natives | 0.4 /100 | #245 | Tragic 81.8% |
| Alaskan Athabascans | 0.4 /100 | #246 | Tragic 81.8% |
| Central Americans | 0.4 /100 | #247 | Tragic 81.7% |
| Puget Sound Salish | 0.3 /100 | #248 | Tragic 81.7% |
| Hmong | 0.3 /100 | #249 | Tragic 81.7% |
| Immigrants | Armenia | 0.2 /100 | #250 | Tragic 81.7% |
| Guamanians/Chamorros | 0.2 /100 | #251 | Tragic 81.6% |
| Pennsylvania Germans | 0.2 /100 | #252 | Tragic 81.6% |
| Japanese | 0.2 /100 | #253 | Tragic 81.6% |
| Immigrants | Laos | 0.2 /100 | #254 | Tragic 81.6% |
| Scotch-Irish | 0.2 /100 | #255 | Tragic 81.6% |
| Barbadians | 0.1 /100 | #256 | Tragic 81.6% |
| Immigrants | Congo | 0.1 /100 | #257 | Tragic 81.6% |
| Immigrants | Fiji | 0.1 /100 | #258 | Tragic 81.5% |
| Guyanese | 0.1 /100 | #259 | Tragic 81.5% |
Demographics Similar to Immigrants from Lithuania by In Labor Force | Age 45-54
In terms of in labor force | age 45-54, the demographic groups most similar to Immigrants from Lithuania are Immigrants from Brazil (83.9%, a difference of 0.010%), Immigrants from Serbia (83.9%, a difference of 0.020%), Immigrants from Pakistan (83.8%, a difference of 0.020%), Immigrants from North Macedonia (83.9%, a difference of 0.030%), and Immigrants from Bulgaria (83.8%, a difference of 0.040%).
| Demographics | Rating | Rank | In Labor Force | Age 45-54 |
| Immigrants | Sri Lanka | 99.8 /100 | #21 | Exceptional 83.9% |
| Immigrants | Ireland | 99.8 /100 | #22 | Exceptional 83.9% |
| Tlingit-Haida | 99.8 /100 | #23 | Exceptional 83.9% |
| Slovenes | 99.8 /100 | #24 | Exceptional 83.9% |
| Immigrants | North Macedonia | 99.8 /100 | #25 | Exceptional 83.9% |
| Immigrants | Serbia | 99.8 /100 | #26 | Exceptional 83.9% |
| Immigrants | Brazil | 99.8 /100 | #27 | Exceptional 83.9% |
| Immigrants | Lithuania | 99.8 /100 | #28 | Exceptional 83.9% |
| Immigrants | Pakistan | 99.7 /100 | #29 | Exceptional 83.8% |
| Immigrants | Bulgaria | 99.7 /100 | #30 | Exceptional 83.8% |
| Immigrants | Eritrea | 99.7 /100 | #31 | Exceptional 83.8% |
| Turks | 99.7 /100 | #32 | Exceptional 83.8% |
| Latvians | 99.7 /100 | #33 | Exceptional 83.8% |
| Kenyans | 99.5 /100 | #34 | Exceptional 83.7% |
| Brazilians | 99.5 /100 | #35 | Exceptional 83.7% |