U.S. Virgin Islander vs Immigrants In Labor Force | Age 35-44
COMPARE
U.S. Virgin Islander
Immigrants
In Labor Force | Age 35-44
In Labor Force | Age 35-44 Comparison
U.S. Virgin Islanders
Immigrants
84.0%
IN LABOR FORCE | AGE 35-44
6.1/ 100
METRIC RATING
224th/ 347
METRIC RANK
83.7%
IN LABOR FORCE | AGE 35-44
1.0/ 100
METRIC RATING
246th/ 347
METRIC RANK
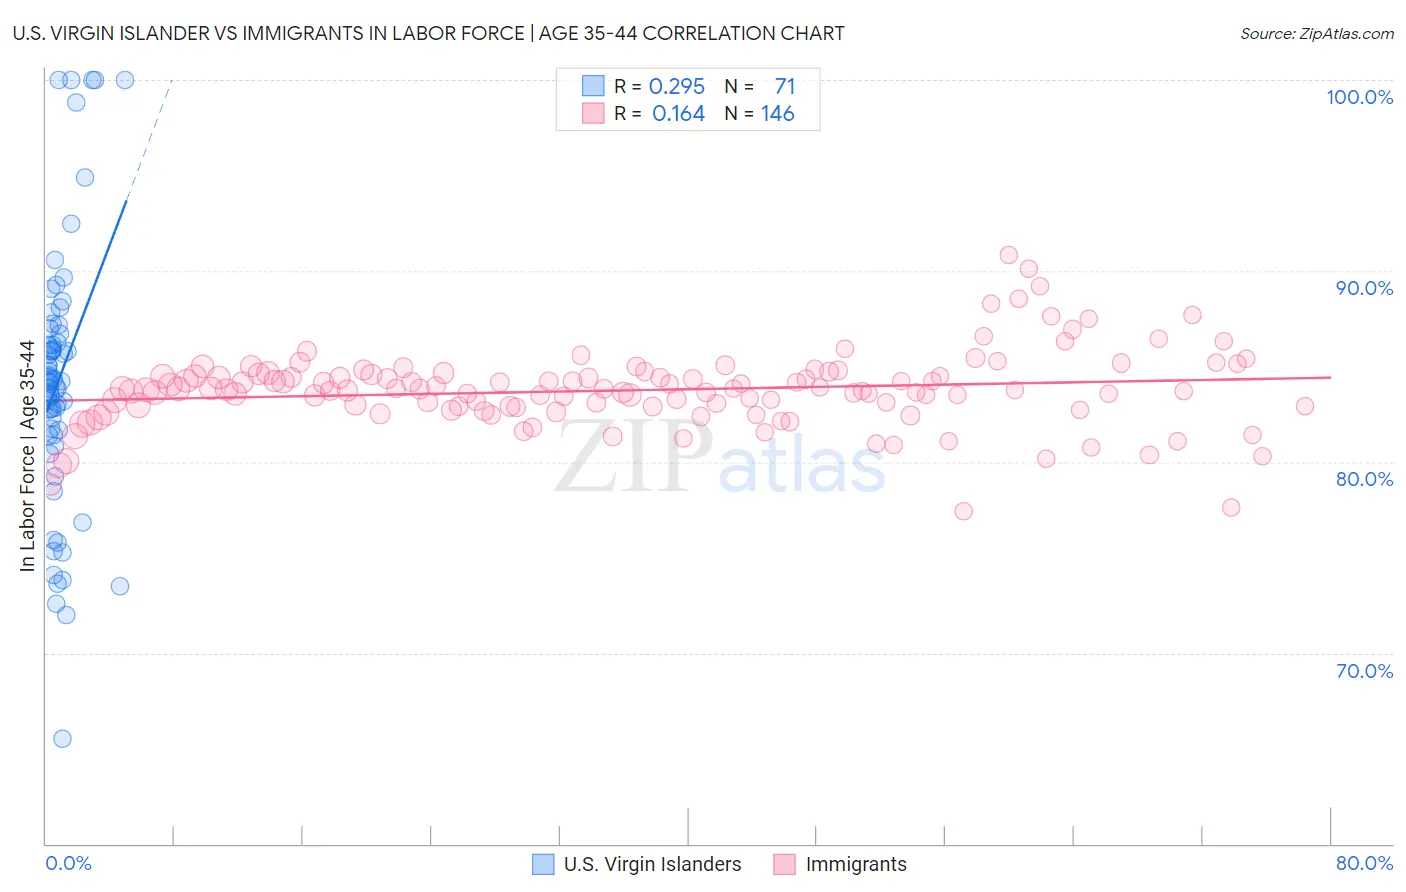
U.S. Virgin Islander vs Immigrants In Labor Force | Age 35-44 Correlation Chart
The statistical analysis conducted on geographies consisting of 87,507,209 people shows a weak positive correlation between the proportion of U.S. Virgin Islanders and labor force participation rate among population between the ages 35 and 44 in the United States with a correlation coefficient (R) of 0.295 and weighted average of 84.0%. Similarly, the statistical analysis conducted on geographies consisting of 576,964,624 people shows a poor positive correlation between the proportion of Immigrants and labor force participation rate among population between the ages 35 and 44 in the United States with a correlation coefficient (R) of 0.164 and weighted average of 83.7%, a difference of 0.30%.
In Labor Force | Age 35-44 Correlation Summary
| Measurement | U.S. Virgin Islander | Immigrants |
| Minimum | 65.5% | 77.4% |
| Maximum | 100.0% | 90.8% |
| Range | 34.5% | 13.4% |
| Mean | 84.3% | 83.8% |
| Median | 84.2% | 83.8% |
| Interquartile 25% (IQ1) | 81.4% | 82.9% |
| Interquartile 75% (IQ3) | 87.0% | 84.6% |
| Interquartile Range (IQR) | 5.6% | 1.7% |
| Standard Deviation (Sample) | 7.0% | 2.0% |
| Standard Deviation (Population) | 6.9% | 2.0% |
Similar Demographics by In Labor Force | Age 35-44
Demographics Similar to U.S. Virgin Islanders by In Labor Force | Age 35-44
In terms of in labor force | age 35-44, the demographic groups most similar to U.S. Virgin Islanders are Immigrants from Burma/Myanmar (84.0%, a difference of 0.0%), Assyrian/Chaldean/Syriac (84.0%, a difference of 0.010%), Immigrants from Panama (84.0%, a difference of 0.010%), Icelander (84.0%, a difference of 0.020%), and Panamanian (84.0%, a difference of 0.020%).
| Demographics | Rating | Rank | In Labor Force | Age 35-44 |
| Immigrants | Norway | 11.7 /100 | #217 | Poor 84.1% |
| Immigrants | Nicaragua | 9.4 /100 | #218 | Tragic 84.1% |
| Sub-Saharan Africans | 9.3 /100 | #219 | Tragic 84.1% |
| French | 7.5 /100 | #220 | Tragic 84.0% |
| Icelanders | 6.7 /100 | #221 | Tragic 84.0% |
| Assyrians/Chaldeans/Syriacs | 6.6 /100 | #222 | Tragic 84.0% |
| Immigrants | Panama | 6.4 /100 | #223 | Tragic 84.0% |
| U.S. Virgin Islanders | 6.1 /100 | #224 | Tragic 84.0% |
| Immigrants | Burma/Myanmar | 6.1 /100 | #225 | Tragic 84.0% |
| Panamanians | 5.4 /100 | #226 | Tragic 84.0% |
| British West Indians | 5.3 /100 | #227 | Tragic 84.0% |
| Welsh | 5.3 /100 | #228 | Tragic 84.0% |
| Immigrants | Thailand | 4.7 /100 | #229 | Tragic 84.0% |
| Immigrants | Iraq | 3.7 /100 | #230 | Tragic 83.9% |
| Scottish | 3.2 /100 | #231 | Tragic 83.9% |
Demographics Similar to Immigrants by In Labor Force | Age 35-44
In terms of in labor force | age 35-44, the demographic groups most similar to Immigrants are Guyanese (83.8%, a difference of 0.010%), Malaysian (83.8%, a difference of 0.010%), Immigrants from Cambodia (83.8%, a difference of 0.020%), Immigrants from Western Asia (83.8%, a difference of 0.020%), and Immigrants from Armenia (83.7%, a difference of 0.020%).
| Demographics | Rating | Rank | In Labor Force | Age 35-44 |
| Celtics | 1.4 /100 | #239 | Tragic 83.8% |
| Arabs | 1.3 /100 | #240 | Tragic 83.8% |
| Iraqis | 1.3 /100 | #241 | Tragic 83.8% |
| Immigrants | Cambodia | 1.1 /100 | #242 | Tragic 83.8% |
| Immigrants | Western Asia | 1.1 /100 | #243 | Tragic 83.8% |
| Guyanese | 1.1 /100 | #244 | Tragic 83.8% |
| Malaysians | 1.1 /100 | #245 | Tragic 83.8% |
| Immigrants | Immigrants | 1.0 /100 | #246 | Tragic 83.7% |
| Immigrants | Armenia | 0.9 /100 | #247 | Tragic 83.7% |
| Indonesians | 0.8 /100 | #248 | Tragic 83.7% |
| Immigrants | St. Vincent and the Grenadines | 0.7 /100 | #249 | Tragic 83.7% |
| Whites/Caucasians | 0.5 /100 | #250 | Tragic 83.6% |
| Salvadorans | 0.4 /100 | #251 | Tragic 83.6% |
| Immigrants | Guyana | 0.4 /100 | #252 | Tragic 83.6% |
| Lebanese | 0.4 /100 | #253 | Tragic 83.6% |