Uruguayan vs Native/Alaskan Median Family Income
COMPARE
Uruguayan
Native/Alaskan
Median Family Income
Median Family Income Comparison
Uruguayans
Natives/Alaskans
$100,656
MEDIAN FAMILY INCOME
26.3/ 100
METRIC RATING
194th/ 347
METRIC RANK
$80,908
MEDIAN FAMILY INCOME
0.0/ 100
METRIC RATING
332nd/ 347
METRIC RANK
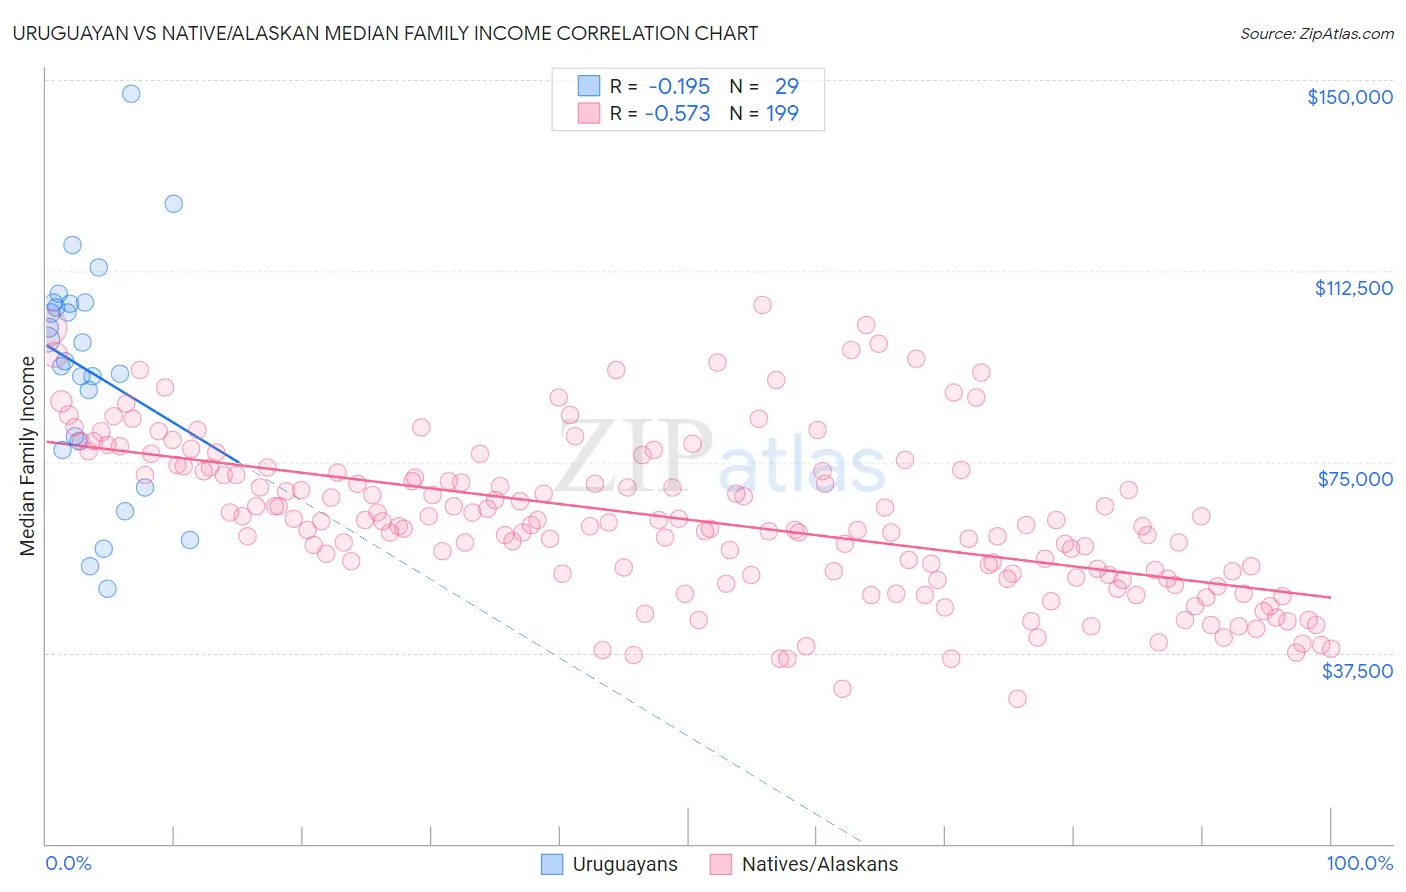
Uruguayan vs Native/Alaskan Median Family Income Correlation Chart
The statistical analysis conducted on geographies consisting of 144,757,564 people shows a poor negative correlation between the proportion of Uruguayans and median family income in the United States with a correlation coefficient (R) of -0.195 and weighted average of $100,656. Similarly, the statistical analysis conducted on geographies consisting of 512,223,526 people shows a substantial negative correlation between the proportion of Natives/Alaskans and median family income in the United States with a correlation coefficient (R) of -0.573 and weighted average of $80,908, a difference of 24.4%.
Median Family Income Correlation Summary
| Measurement | Uruguayan | Native/Alaskan |
| Minimum | $50,000 | $28,542 |
| Maximum | $147,344 | $105,692 |
| Range | $97,344 | $77,150 |
| Mean | $92,799 | $63,631 |
| Median | $94,724 | $62,694 |
| Interquartile 25% (IQ1) | $78,231 | $52,723 |
| Interquartile 75% (IQ3) | $106,137 | $73,193 |
| Interquartile Range (IQR) | $27,906 | $20,470 |
| Standard Deviation (Sample) | $22,298 | $15,516 |
| Standard Deviation (Population) | $21,910 | $15,477 |
Similar Demographics by Median Family Income
Demographics Similar to Uruguayans by Median Family Income
In terms of median family income, the demographic groups most similar to Uruguayans are Iraqi ($100,658, a difference of 0.0%), Immigrants from Kenya ($100,679, a difference of 0.020%), Colombian ($100,750, a difference of 0.090%), Immigrants from South America ($100,414, a difference of 0.24%), and Immigrants ($100,962, a difference of 0.30%).
| Demographics | Rating | Rank | Median Family Income |
| Tlingit-Haida | 30.8 /100 | #187 | Fair $101,092 |
| Guamanians/Chamorros | 30.5 /100 | #188 | Fair $101,061 |
| Immigrants | Portugal | 29.6 /100 | #189 | Fair $100,984 |
| Immigrants | Immigrants | 29.4 /100 | #190 | Fair $100,962 |
| Colombians | 27.2 /100 | #191 | Fair $100,750 |
| Immigrants | Kenya | 26.5 /100 | #192 | Fair $100,679 |
| Iraqis | 26.3 /100 | #193 | Fair $100,658 |
| Uruguayans | 26.3 /100 | #194 | Fair $100,656 |
| Immigrants | South America | 23.9 /100 | #195 | Fair $100,414 |
| Samoans | 23.3 /100 | #196 | Fair $100,344 |
| Immigrants | Cameroon | 22.8 /100 | #197 | Fair $100,289 |
| Immigrants | Africa | 22.5 /100 | #198 | Fair $100,256 |
| Yugoslavians | 21.3 /100 | #199 | Fair $100,119 |
| Spanish | 20.1 /100 | #200 | Fair $99,977 |
| Immigrants | Thailand | 19.0 /100 | #201 | Poor $99,840 |
Demographics Similar to Natives/Alaskans by Median Family Income
In terms of median family income, the demographic groups most similar to Natives/Alaskans are Kiowa ($80,885, a difference of 0.030%), Immigrants from Dominican Republic ($81,233, a difference of 0.40%), Cheyenne ($81,385, a difference of 0.59%), Dutch West Indian ($81,852, a difference of 1.2%), and Black/African American ($81,912, a difference of 1.2%).
| Demographics | Rating | Rank | Median Family Income |
| Sioux | 0.0 /100 | #325 | Tragic $82,386 |
| Immigrants | Congo | 0.0 /100 | #326 | Tragic $82,216 |
| Arapaho | 0.0 /100 | #327 | Tragic $82,064 |
| Blacks/African Americans | 0.0 /100 | #328 | Tragic $81,912 |
| Dutch West Indians | 0.0 /100 | #329 | Tragic $81,852 |
| Cheyenne | 0.0 /100 | #330 | Tragic $81,385 |
| Immigrants | Dominican Republic | 0.0 /100 | #331 | Tragic $81,233 |
| Natives/Alaskans | 0.0 /100 | #332 | Tragic $80,908 |
| Kiowa | 0.0 /100 | #333 | Tragic $80,885 |
| Menominee | 0.0 /100 | #334 | Tragic $79,563 |
| Yup'ik | 0.0 /100 | #335 | Tragic $79,290 |
| Immigrants | Cuba | 0.0 /100 | #336 | Tragic $78,249 |
| Yuman | 0.0 /100 | #337 | Tragic $78,055 |
| Immigrants | Yemen | 0.0 /100 | #338 | Tragic $77,457 |
| Pima | 0.0 /100 | #339 | Tragic $77,431 |