Ukrainian vs Jordanian In Labor Force | Age 30-34
COMPARE
Ukrainian
Jordanian
In Labor Force | Age 30-34
In Labor Force | Age 30-34 Comparison
Ukrainians
Jordanians
85.2%
IN LABOR FORCE | AGE 30-34
96.6/ 100
METRIC RATING
103rd/ 347
METRIC RANK
85.0%
IN LABOR FORCE | AGE 30-34
88.6/ 100
METRIC RATING
136th/ 347
METRIC RANK
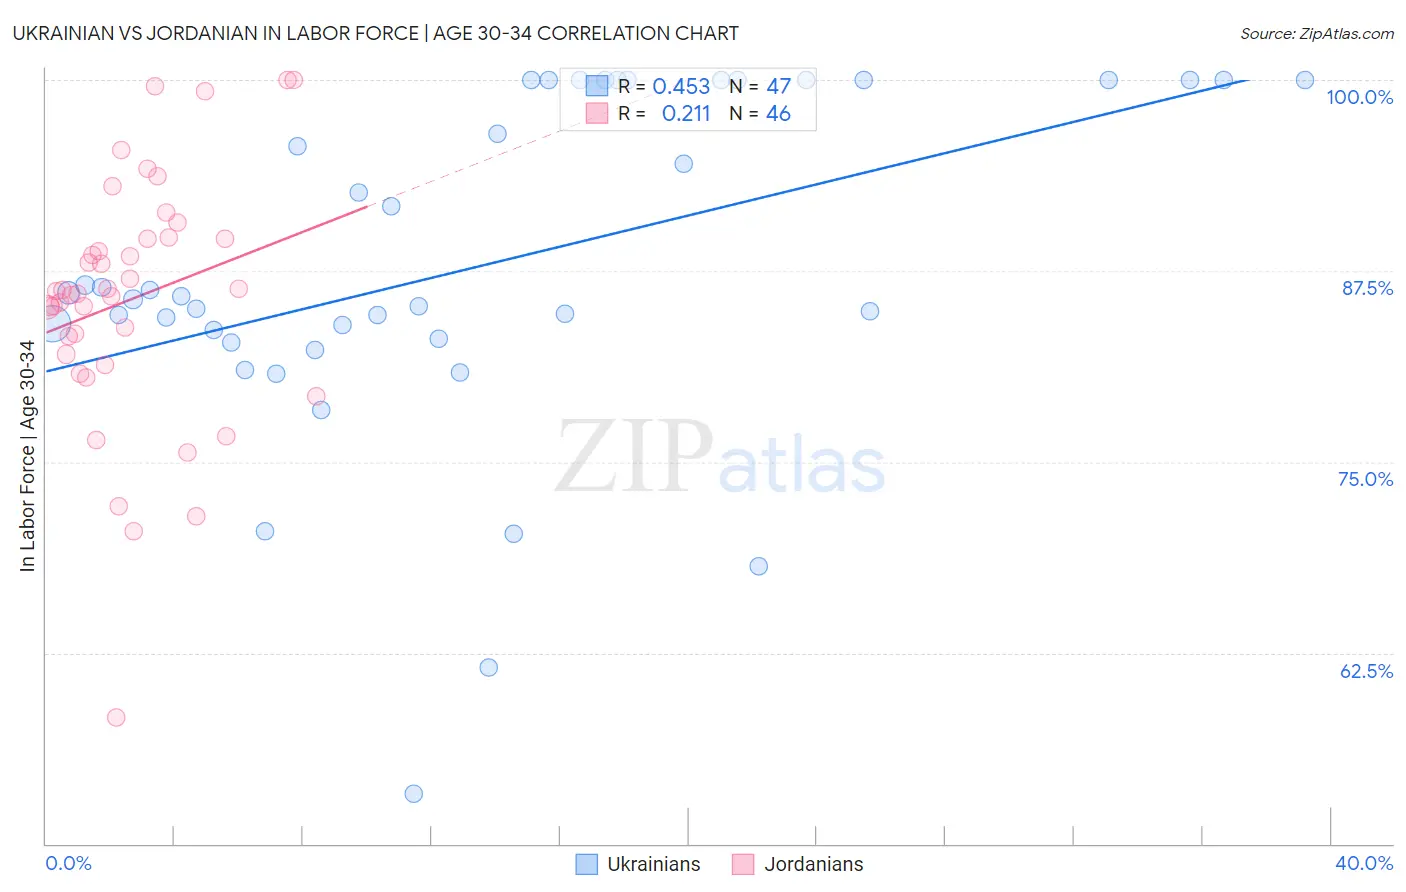
Ukrainian vs Jordanian In Labor Force | Age 30-34 Correlation Chart
The statistical analysis conducted on geographies consisting of 448,215,384 people shows a moderate positive correlation between the proportion of Ukrainians and labor force participation rate among population between the ages 30 and 34 in the United States with a correlation coefficient (R) of 0.453 and weighted average of 85.2%. Similarly, the statistical analysis conducted on geographies consisting of 166,400,430 people shows a weak positive correlation between the proportion of Jordanians and labor force participation rate among population between the ages 30 and 34 in the United States with a correlation coefficient (R) of 0.211 and weighted average of 85.0%, a difference of 0.22%.
In Labor Force | Age 30-34 Correlation Summary
| Measurement | Ukrainian | Jordanian |
| Minimum | 53.3% | 58.3% |
| Maximum | 100.0% | 100.0% |
| Range | 46.7% | 41.7% |
| Mean | 87.8% | 85.6% |
| Median | 85.8% | 86.1% |
| Interquartile 25% (IQ1) | 83.0% | 82.0% |
| Interquartile 75% (IQ3) | 100.0% | 89.6% |
| Interquartile Range (IQR) | 17.0% | 7.6% |
| Standard Deviation (Sample) | 11.1% | 8.2% |
| Standard Deviation (Population) | 10.9% | 8.1% |
Similar Demographics by In Labor Force | Age 30-34
Demographics Similar to Ukrainians by In Labor Force | Age 30-34
In terms of in labor force | age 30-34, the demographic groups most similar to Ukrainians are Immigrants from Ghana (85.2%, a difference of 0.0%), Immigrants from Austria (85.2%, a difference of 0.010%), Alsatian (85.2%, a difference of 0.010%), Immigrants from Middle Africa (85.2%, a difference of 0.010%), and Immigrants from Northern Africa (85.2%, a difference of 0.010%).
| Demographics | Rating | Rank | In Labor Force | Age 30-34 |
| Immigrants | Korea | 97.3 /100 | #96 | Exceptional 85.2% |
| Thais | 97.2 /100 | #97 | Exceptional 85.2% |
| Immigrants | Uganda | 97.2 /100 | #98 | Exceptional 85.2% |
| Belgians | 97.2 /100 | #99 | Exceptional 85.2% |
| Sudanese | 97.1 /100 | #100 | Exceptional 85.2% |
| Immigrants | Belarus | 96.9 /100 | #101 | Exceptional 85.2% |
| Immigrants | Austria | 96.8 /100 | #102 | Exceptional 85.2% |
| Ukrainians | 96.6 /100 | #103 | Exceptional 85.2% |
| Immigrants | Ghana | 96.5 /100 | #104 | Exceptional 85.2% |
| Alsatians | 96.3 /100 | #105 | Exceptional 85.2% |
| Immigrants | Middle Africa | 96.3 /100 | #106 | Exceptional 85.2% |
| Immigrants | Northern Africa | 96.3 /100 | #107 | Exceptional 85.2% |
| Immigrants | Zimbabwe | 95.8 /100 | #108 | Exceptional 85.1% |
| Argentineans | 95.8 /100 | #109 | Exceptional 85.1% |
| Immigrants | South Africa | 95.3 /100 | #110 | Exceptional 85.1% |
Demographics Similar to Jordanians by In Labor Force | Age 30-34
In terms of in labor force | age 30-34, the demographic groups most similar to Jordanians are Immigrants from Chile (85.0%, a difference of 0.010%), Immigrants from Asia (85.0%, a difference of 0.010%), South African (85.0%, a difference of 0.010%), Sri Lankan (85.0%, a difference of 0.010%), and Chinese (85.0%, a difference of 0.020%).
| Demographics | Rating | Rank | In Labor Force | Age 30-34 |
| Immigrants | Western Africa | 90.2 /100 | #129 | Exceptional 85.0% |
| Immigrants | Spain | 90.0 /100 | #130 | Exceptional 85.0% |
| Chinese | 89.6 /100 | #131 | Excellent 85.0% |
| Immigrants | Israel | 89.5 /100 | #132 | Excellent 85.0% |
| New Zealanders | 89.5 /100 | #133 | Excellent 85.0% |
| Immigrants | Chile | 89.2 /100 | #134 | Excellent 85.0% |
| Immigrants | Asia | 88.9 /100 | #135 | Excellent 85.0% |
| Jordanians | 88.6 /100 | #136 | Excellent 85.0% |
| South Africans | 88.0 /100 | #137 | Excellent 85.0% |
| Sri Lankans | 87.8 /100 | #138 | Excellent 85.0% |
| Bhutanese | 87.5 /100 | #139 | Excellent 85.0% |
| Immigrants | Vietnam | 86.5 /100 | #140 | Excellent 85.0% |
| Chileans | 85.3 /100 | #141 | Excellent 84.9% |
| Immigrants | Indonesia | 84.3 /100 | #142 | Excellent 84.9% |
| Colombians | 82.2 /100 | #143 | Excellent 84.9% |