Trinidadian and Tobagonian vs Ukrainian In Labor Force | Age 35-44
COMPARE
Trinidadian and Tobagonian
Ukrainian
In Labor Force | Age 35-44
In Labor Force | Age 35-44 Comparison
Trinidadians and Tobagonians
Ukrainians
84.5%
IN LABOR FORCE | AGE 35-44
69.5/ 100
METRIC RATING
153rd/ 347
METRIC RANK
84.7%
IN LABOR FORCE | AGE 35-44
93.5/ 100
METRIC RATING
111th/ 347
METRIC RANK
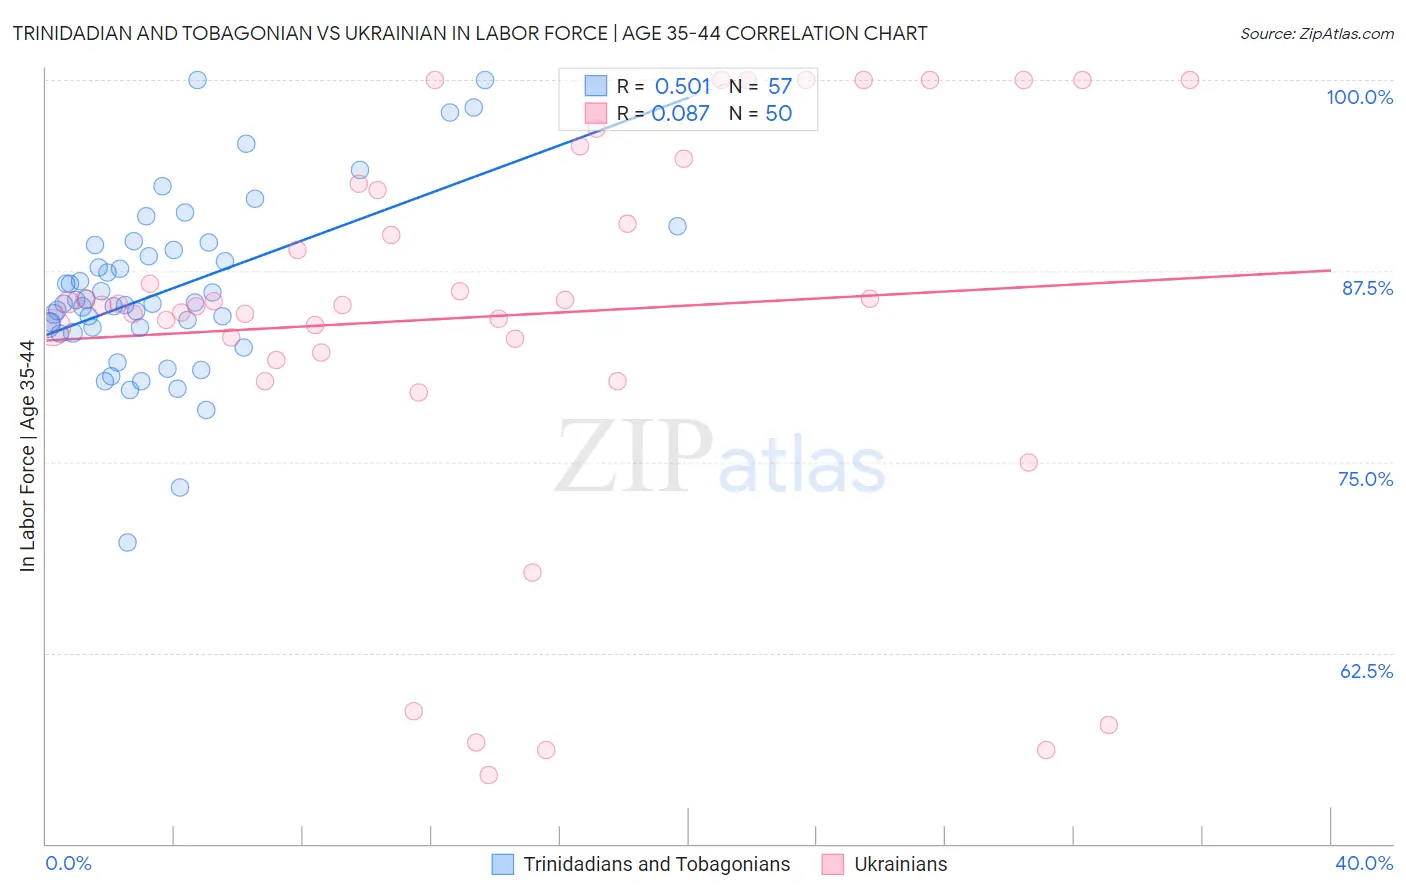
Trinidadian and Tobagonian vs Ukrainian In Labor Force | Age 35-44 Correlation Chart
The statistical analysis conducted on geographies consisting of 219,757,398 people shows a substantial positive correlation between the proportion of Trinidadians and Tobagonians and labor force participation rate among population between the ages 35 and 44 in the United States with a correlation coefficient (R) of 0.501 and weighted average of 84.5%. Similarly, the statistical analysis conducted on geographies consisting of 448,358,650 people shows a slight positive correlation between the proportion of Ukrainians and labor force participation rate among population between the ages 35 and 44 in the United States with a correlation coefficient (R) of 0.087 and weighted average of 84.7%, a difference of 0.30%.
In Labor Force | Age 35-44 Correlation Summary
| Measurement | Trinidadian and Tobagonian | Ukrainian |
| Minimum | 69.7% | 54.5% |
| Maximum | 100.0% | 100.0% |
| Range | 30.3% | 45.5% |
| Mean | 86.2% | 84.6% |
| Median | 85.4% | 85.3% |
| Interquartile 25% (IQ1) | 83.6% | 82.1% |
| Interquartile 75% (IQ3) | 89.0% | 93.2% |
| Interquartile Range (IQR) | 5.4% | 11.0% |
| Standard Deviation (Sample) | 5.7% | 12.7% |
| Standard Deviation (Population) | 5.7% | 12.6% |
Similar Demographics by In Labor Force | Age 35-44
Demographics Similar to Trinidadians and Tobagonians by In Labor Force | Age 35-44
In terms of in labor force | age 35-44, the demographic groups most similar to Trinidadians and Tobagonians are Iranian (84.5%, a difference of 0.0%), Immigrants from Taiwan (84.5%, a difference of 0.010%), Romanian (84.5%, a difference of 0.020%), South American Indian (84.5%, a difference of 0.030%), and Okinawan (84.5%, a difference of 0.030%).
| Demographics | Rating | Rank | In Labor Force | Age 35-44 |
| Immigrants | Asia | 78.7 /100 | #146 | Good 84.5% |
| Immigrants | Netherlands | 76.6 /100 | #147 | Good 84.5% |
| South American Indians | 73.6 /100 | #148 | Good 84.5% |
| Okinawans | 73.5 /100 | #149 | Good 84.5% |
| Immigrants | Nigeria | 73.3 /100 | #150 | Good 84.5% |
| Romanians | 72.1 /100 | #151 | Good 84.5% |
| Immigrants | Taiwan | 71.4 /100 | #152 | Good 84.5% |
| Trinidadians and Tobagonians | 69.5 /100 | #153 | Good 84.5% |
| Iranians | 69.4 /100 | #154 | Good 84.5% |
| Immigrants | Switzerland | 65.9 /100 | #155 | Good 84.5% |
| Immigrants | Israel | 64.3 /100 | #156 | Good 84.4% |
| Immigrants | Austria | 63.8 /100 | #157 | Good 84.4% |
| Jamaicans | 62.7 /100 | #158 | Good 84.4% |
| Immigrants | Senegal | 60.4 /100 | #159 | Good 84.4% |
| Immigrants | Kazakhstan | 60.4 /100 | #160 | Good 84.4% |
Demographics Similar to Ukrainians by In Labor Force | Age 35-44
In terms of in labor force | age 35-44, the demographic groups most similar to Ukrainians are Immigrants from Western Africa (84.7%, a difference of 0.0%), Filipino (84.7%, a difference of 0.010%), Uruguayan (84.7%, a difference of 0.010%), Chilean (84.7%, a difference of 0.010%), and Bahamian (84.7%, a difference of 0.010%).
| Demographics | Rating | Rank | In Labor Force | Age 35-44 |
| Immigrants | Sweden | 95.2 /100 | #104 | Exceptional 84.8% |
| South Americans | 95.0 /100 | #105 | Exceptional 84.8% |
| Immigrants | Bahamas | 94.8 /100 | #106 | Exceptional 84.8% |
| Immigrants | Romania | 94.7 /100 | #107 | Exceptional 84.8% |
| Immigrants | Argentina | 94.5 /100 | #108 | Exceptional 84.8% |
| Immigrants | Russia | 94.5 /100 | #109 | Exceptional 84.8% |
| Filipinos | 93.8 /100 | #110 | Exceptional 84.7% |
| Ukrainians | 93.5 /100 | #111 | Exceptional 84.7% |
| Immigrants | Western Africa | 93.4 /100 | #112 | Exceptional 84.7% |
| Uruguayans | 93.3 /100 | #113 | Exceptional 84.7% |
| Chileans | 93.2 /100 | #114 | Exceptional 84.7% |
| Bahamians | 93.2 /100 | #115 | Exceptional 84.7% |
| Immigrants | Egypt | 92.7 /100 | #116 | Exceptional 84.7% |
| Immigrants | China | 92.3 /100 | #117 | Exceptional 84.7% |
| Immigrants | Eastern Asia | 92.1 /100 | #118 | Exceptional 84.7% |