Trinidadian and Tobagonian vs Ecuadorian In Labor Force | Age 35-44
COMPARE
Trinidadian and Tobagonian
Ecuadorian
In Labor Force | Age 35-44
In Labor Force | Age 35-44 Comparison
Trinidadians and Tobagonians
Ecuadorians
84.5%
IN LABOR FORCE | AGE 35-44
69.5/ 100
METRIC RATING
153rd/ 347
METRIC RANK
84.2%
IN LABOR FORCE | AGE 35-44
24.0/ 100
METRIC RATING
198th/ 347
METRIC RANK
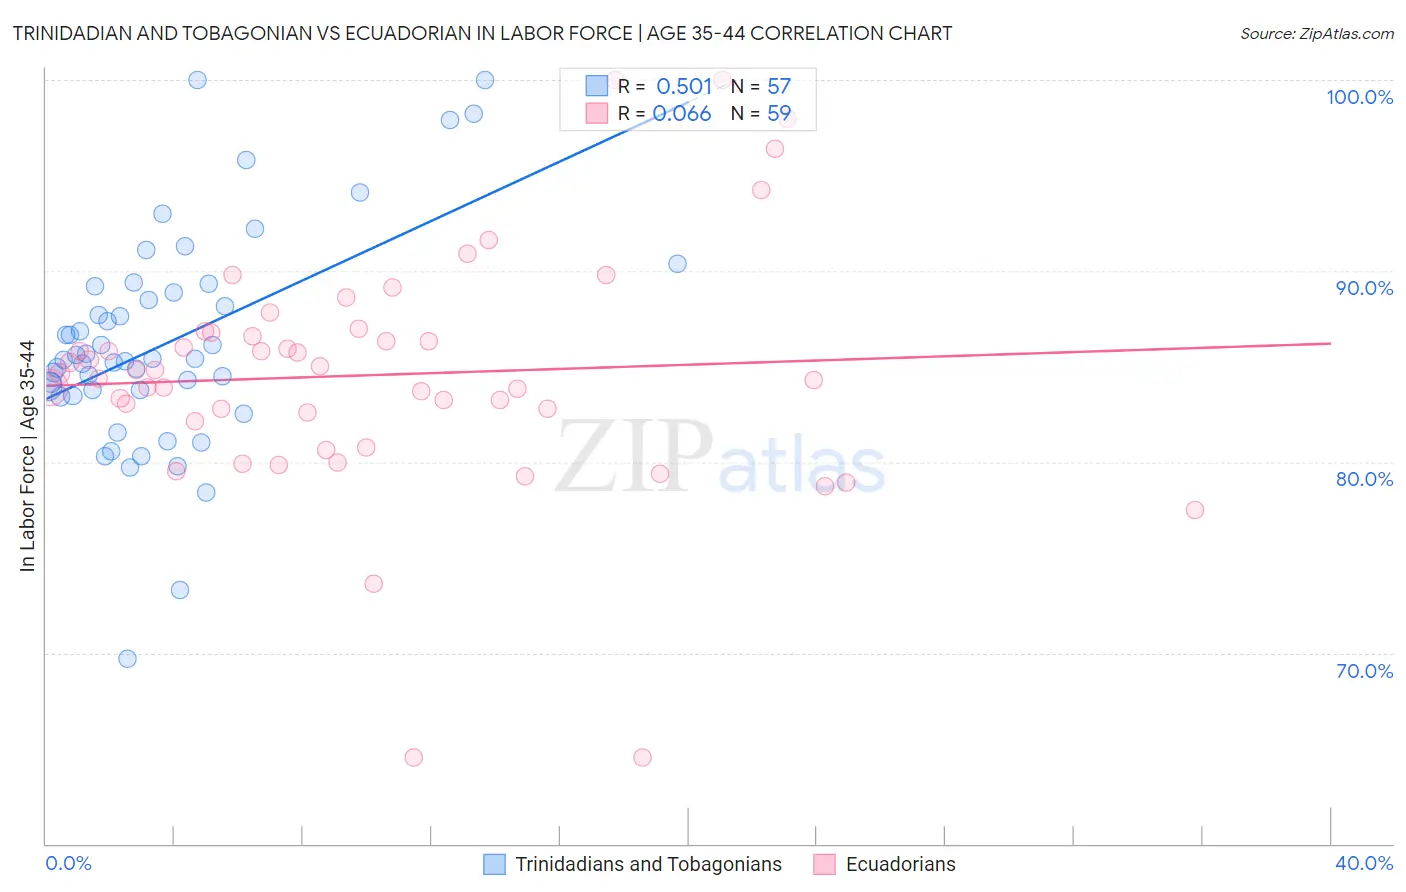
Trinidadian and Tobagonian vs Ecuadorian In Labor Force | Age 35-44 Correlation Chart
The statistical analysis conducted on geographies consisting of 219,757,398 people shows a substantial positive correlation between the proportion of Trinidadians and Tobagonians and labor force participation rate among population between the ages 35 and 44 in the United States with a correlation coefficient (R) of 0.501 and weighted average of 84.5%. Similarly, the statistical analysis conducted on geographies consisting of 317,693,933 people shows a slight positive correlation between the proportion of Ecuadorians and labor force participation rate among population between the ages 35 and 44 in the United States with a correlation coefficient (R) of 0.066 and weighted average of 84.2%, a difference of 0.32%.
In Labor Force | Age 35-44 Correlation Summary
| Measurement | Trinidadian and Tobagonian | Ecuadorian |
| Minimum | 69.7% | 64.5% |
| Maximum | 100.0% | 100.0% |
| Range | 30.3% | 35.5% |
| Mean | 86.2% | 84.6% |
| Median | 85.4% | 84.6% |
| Interquartile 25% (IQ1) | 83.6% | 82.1% |
| Interquartile 75% (IQ3) | 89.0% | 86.8% |
| Interquartile Range (IQR) | 5.4% | 4.7% |
| Standard Deviation (Sample) | 5.7% | 6.4% |
| Standard Deviation (Population) | 5.7% | 6.3% |
Similar Demographics by In Labor Force | Age 35-44
Demographics Similar to Trinidadians and Tobagonians by In Labor Force | Age 35-44
In terms of in labor force | age 35-44, the demographic groups most similar to Trinidadians and Tobagonians are Iranian (84.5%, a difference of 0.0%), Immigrants from Taiwan (84.5%, a difference of 0.010%), Romanian (84.5%, a difference of 0.020%), South American Indian (84.5%, a difference of 0.030%), and Okinawan (84.5%, a difference of 0.030%).
| Demographics | Rating | Rank | In Labor Force | Age 35-44 |
| Immigrants | Asia | 78.7 /100 | #146 | Good 84.5% |
| Immigrants | Netherlands | 76.6 /100 | #147 | Good 84.5% |
| South American Indians | 73.6 /100 | #148 | Good 84.5% |
| Okinawans | 73.5 /100 | #149 | Good 84.5% |
| Immigrants | Nigeria | 73.3 /100 | #150 | Good 84.5% |
| Romanians | 72.1 /100 | #151 | Good 84.5% |
| Immigrants | Taiwan | 71.4 /100 | #152 | Good 84.5% |
| Trinidadians and Tobagonians | 69.5 /100 | #153 | Good 84.5% |
| Iranians | 69.4 /100 | #154 | Good 84.5% |
| Immigrants | Switzerland | 65.9 /100 | #155 | Good 84.5% |
| Immigrants | Israel | 64.3 /100 | #156 | Good 84.4% |
| Immigrants | Austria | 63.8 /100 | #157 | Good 84.4% |
| Jamaicans | 62.7 /100 | #158 | Good 84.4% |
| Immigrants | Senegal | 60.4 /100 | #159 | Good 84.4% |
| Immigrants | Kazakhstan | 60.4 /100 | #160 | Good 84.4% |
Demographics Similar to Ecuadorians by In Labor Force | Age 35-44
In terms of in labor force | age 35-44, the demographic groups most similar to Ecuadorians are Immigrants from Caribbean (84.2%, a difference of 0.010%), Immigrants from England (84.2%, a difference of 0.010%), Immigrants from Western Europe (84.2%, a difference of 0.010%), Syrian (84.2%, a difference of 0.010%), and Moroccan (84.2%, a difference of 0.010%).
| Demographics | Rating | Rank | In Labor Force | Age 35-44 |
| Immigrants | Philippines | 27.9 /100 | #191 | Fair 84.2% |
| Immigrants | Vietnam | 27.4 /100 | #192 | Fair 84.2% |
| Hungarians | 26.8 /100 | #193 | Fair 84.2% |
| Immigrants | Indonesia | 25.7 /100 | #194 | Fair 84.2% |
| Immigrants | Caribbean | 25.7 /100 | #195 | Fair 84.2% |
| Immigrants | England | 25.0 /100 | #196 | Fair 84.2% |
| Immigrants | Western Europe | 24.7 /100 | #197 | Fair 84.2% |
| Ecuadorians | 24.0 /100 | #198 | Fair 84.2% |
| Syrians | 23.2 /100 | #199 | Fair 84.2% |
| Moroccans | 23.2 /100 | #200 | Fair 84.2% |
| British | 23.0 /100 | #201 | Fair 84.2% |
| Immigrants | Uzbekistan | 22.8 /100 | #202 | Fair 84.2% |
| Immigrants | South Eastern Asia | 22.4 /100 | #203 | Fair 84.2% |
| Canadians | 19.9 /100 | #204 | Poor 84.2% |
| Immigrants | Canada | 19.6 /100 | #205 | Poor 84.2% |