Trinidadian and Tobagonian vs Ukrainian Seniors Poverty Over the Age of 65
COMPARE
Trinidadian and Tobagonian
Ukrainian
Seniors Poverty Over the Age of 65
Seniors Poverty Over the Age of 65 Comparison
Trinidadians and Tobagonians
Ukrainians
14.2%
SENIORS POVERTY OVER THE AGE OF 65
0.0/ 100
METRIC RATING
308th/ 347
METRIC RANK
10.1%
SENIORS POVERTY OVER THE AGE OF 65
96.9/ 100
METRIC RATING
90th/ 347
METRIC RANK
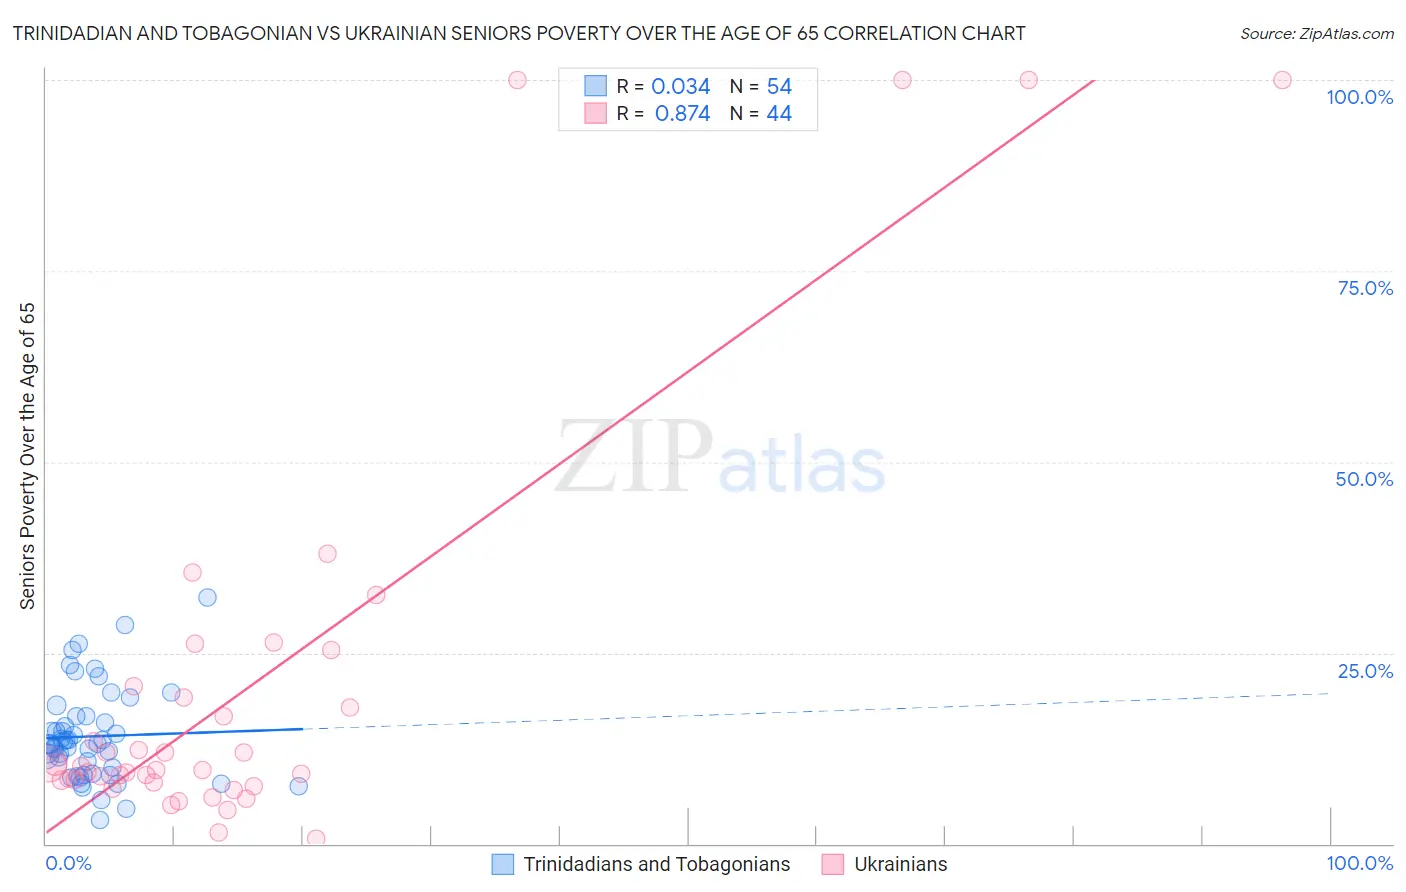
Trinidadian and Tobagonian vs Ukrainian Seniors Poverty Over the Age of 65 Correlation Chart
The statistical analysis conducted on geographies consisting of 219,204,036 people shows no correlation between the proportion of Trinidadians and Tobagonians and poverty level among seniors over the age of 65 in the United States with a correlation coefficient (R) of 0.034 and weighted average of 14.2%. Similarly, the statistical analysis conducted on geographies consisting of 446,354,944 people shows a very strong positive correlation between the proportion of Ukrainians and poverty level among seniors over the age of 65 in the United States with a correlation coefficient (R) of 0.874 and weighted average of 10.1%, a difference of 40.5%.
Seniors Poverty Over the Age of 65 Correlation Summary
| Measurement | Trinidadian and Tobagonian | Ukrainian |
| Minimum | 3.1% | 0.61% |
| Maximum | 32.3% | 100.0% |
| Range | 29.1% | 99.4% |
| Mean | 14.1% | 20.7% |
| Median | 13.1% | 9.9% |
| Interquartile 25% (IQ1) | 9.2% | 8.2% |
| Interquartile 75% (IQ3) | 16.7% | 19.9% |
| Interquartile Range (IQR) | 7.4% | 11.7% |
| Standard Deviation (Sample) | 6.1% | 26.7% |
| Standard Deviation (Population) | 6.0% | 26.4% |
Similar Demographics by Seniors Poverty Over the Age of 65
Demographics Similar to Trinidadians and Tobagonians by Seniors Poverty Over the Age of 65
In terms of seniors poverty over the age of 65, the demographic groups most similar to Trinidadians and Tobagonians are Immigrants from West Indies (14.2%, a difference of 0.070%), Honduran (14.2%, a difference of 0.10%), Immigrants from Latin America (14.2%, a difference of 0.21%), Bahamian (14.2%, a difference of 0.36%), and Native/Alaskan (14.2%, a difference of 0.36%).
| Demographics | Rating | Rank | Seniors Poverty Over the Age of 65 |
| U.S. Virgin Islanders | 0.0 /100 | #301 | Tragic 14.0% |
| Yup'ik | 0.0 /100 | #302 | Tragic 14.1% |
| Immigrants | Bangladesh | 0.0 /100 | #303 | Tragic 14.1% |
| West Indians | 0.0 /100 | #304 | Tragic 14.1% |
| Immigrants | Trinidad and Tobago | 0.0 /100 | #305 | Tragic 14.1% |
| Immigrants | Latin America | 0.0 /100 | #306 | Tragic 14.2% |
| Immigrants | West Indies | 0.0 /100 | #307 | Tragic 14.2% |
| Trinidadians and Tobagonians | 0.0 /100 | #308 | Tragic 14.2% |
| Hondurans | 0.0 /100 | #309 | Tragic 14.2% |
| Bahamians | 0.0 /100 | #310 | Tragic 14.2% |
| Natives/Alaskans | 0.0 /100 | #311 | Tragic 14.2% |
| Hispanics or Latinos | 0.0 /100 | #312 | Tragic 14.3% |
| Barbadians | 0.0 /100 | #313 | Tragic 14.4% |
| Guyanese | 0.0 /100 | #314 | Tragic 14.4% |
| Immigrants | Ecuador | 0.0 /100 | #315 | Tragic 14.4% |
Demographics Similar to Ukrainians by Seniors Poverty Over the Age of 65
In terms of seniors poverty over the age of 65, the demographic groups most similar to Ukrainians are Puget Sound Salish (10.1%, a difference of 0.020%), Immigrants from Singapore (10.1%, a difference of 0.040%), Immigrants from Bulgaria (10.1%, a difference of 0.060%), Jordanian (10.1%, a difference of 0.14%), and Immigrants from Sweden (10.1%, a difference of 0.15%).
| Demographics | Rating | Rank | Seniors Poverty Over the Age of 65 |
| Immigrants | Poland | 97.2 /100 | #83 | Exceptional 10.1% |
| Immigrants | Afghanistan | 97.2 /100 | #84 | Exceptional 10.1% |
| Immigrants | Nepal | 97.2 /100 | #85 | Exceptional 10.1% |
| Romanians | 97.2 /100 | #86 | Exceptional 10.1% |
| Burmese | 97.2 /100 | #87 | Exceptional 10.1% |
| Jordanians | 97.1 /100 | #88 | Exceptional 10.1% |
| Immigrants | Bulgaria | 97.0 /100 | #89 | Exceptional 10.1% |
| Ukrainians | 96.9 /100 | #90 | Exceptional 10.1% |
| Puget Sound Salish | 96.9 /100 | #91 | Exceptional 10.1% |
| Immigrants | Singapore | 96.9 /100 | #92 | Exceptional 10.1% |
| Immigrants | Sweden | 96.7 /100 | #93 | Exceptional 10.1% |
| Immigrants | Germany | 96.7 /100 | #94 | Exceptional 10.1% |
| Immigrants | Japan | 96.3 /100 | #95 | Exceptional 10.1% |
| Basques | 95.9 /100 | #96 | Exceptional 10.2% |
| Immigrants | Pakistan | 95.7 /100 | #97 | Exceptional 10.2% |