Trinidadian and Tobagonian vs Immigrants from Czechoslovakia In Labor Force | Age 20-24
COMPARE
Trinidadian and Tobagonian
Immigrants from Czechoslovakia
In Labor Force | Age 20-24
In Labor Force | Age 20-24 Comparison
Trinidadians and Tobagonians
Immigrants from Czechoslovakia
71.5%
IN LABOR FORCE | AGE 20-24
0.0/ 100
METRIC RATING
320th/ 347
METRIC RANK
75.0%
IN LABOR FORCE | AGE 20-24
44.0/ 100
METRIC RATING
180th/ 347
METRIC RANK
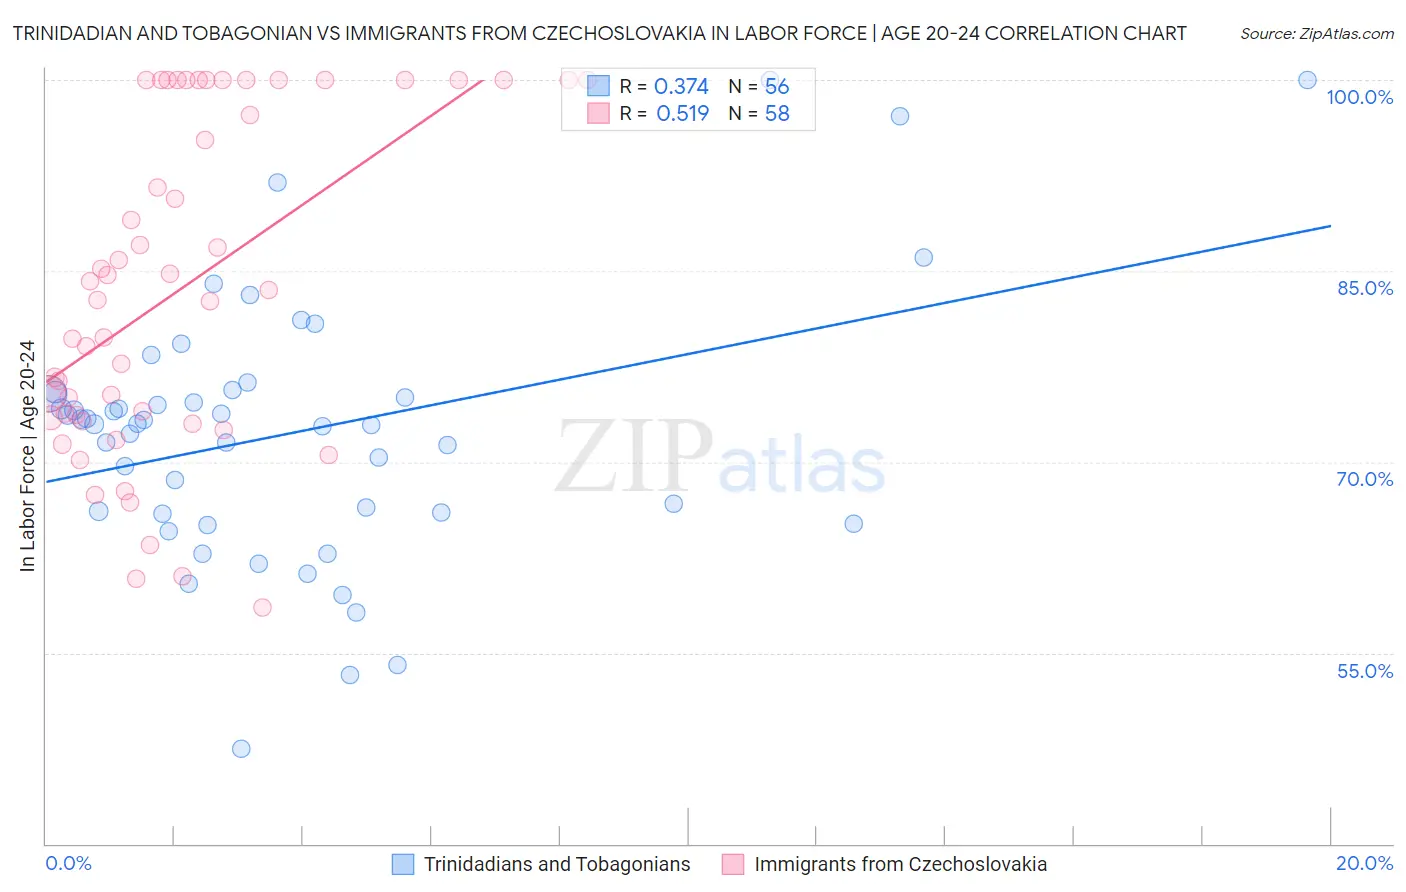
Trinidadian and Tobagonian vs Immigrants from Czechoslovakia In Labor Force | Age 20-24 Correlation Chart
The statistical analysis conducted on geographies consisting of 219,866,832 people shows a mild positive correlation between the proportion of Trinidadians and Tobagonians and labor force participation rate among population between the ages 20 and 24 in the United States with a correlation coefficient (R) of 0.374 and weighted average of 71.5%. Similarly, the statistical analysis conducted on geographies consisting of 195,383,549 people shows a substantial positive correlation between the proportion of Immigrants from Czechoslovakia and labor force participation rate among population between the ages 20 and 24 in the United States with a correlation coefficient (R) of 0.519 and weighted average of 75.0%, a difference of 4.8%.
In Labor Force | Age 20-24 Correlation Summary
| Measurement | Trinidadian and Tobagonian | Immigrants from Czechoslovakia |
| Minimum | 47.5% | 58.6% |
| Maximum | 100.0% | 100.0% |
| Range | 52.5% | 41.4% |
| Mean | 72.3% | 83.6% |
| Median | 73.0% | 83.1% |
| Interquartile 25% (IQ1) | 66.0% | 73.5% |
| Interquartile 75% (IQ3) | 75.4% | 100.0% |
| Interquartile Range (IQR) | 9.4% | 26.5% |
| Standard Deviation (Sample) | 10.4% | 12.9% |
| Standard Deviation (Population) | 10.3% | 12.8% |
Similar Demographics by In Labor Force | Age 20-24
Demographics Similar to Trinidadians and Tobagonians by In Labor Force | Age 20-24
In terms of in labor force | age 20-24, the demographic groups most similar to Trinidadians and Tobagonians are Immigrants from Taiwan (71.5%, a difference of 0.050%), Immigrants from Israel (71.6%, a difference of 0.080%), Immigrants from Hong Kong (71.6%, a difference of 0.11%), Filipino (71.4%, a difference of 0.18%), and Immigrants from Armenia (71.7%, a difference of 0.20%).
| Demographics | Rating | Rank | In Labor Force | Age 20-24 |
| Immigrants | Dominica | 0.0 /100 | #313 | Tragic 71.9% |
| Indians (Asian) | 0.0 /100 | #314 | Tragic 71.9% |
| Immigrants | Iran | 0.0 /100 | #315 | Tragic 71.8% |
| Immigrants | Eastern Asia | 0.0 /100 | #316 | Tragic 71.8% |
| Immigrants | Armenia | 0.0 /100 | #317 | Tragic 71.7% |
| Immigrants | Hong Kong | 0.0 /100 | #318 | Tragic 71.6% |
| Immigrants | Israel | 0.0 /100 | #319 | Tragic 71.6% |
| Trinidadians and Tobagonians | 0.0 /100 | #320 | Tragic 71.5% |
| Immigrants | Taiwan | 0.0 /100 | #321 | Tragic 71.5% |
| Filipinos | 0.0 /100 | #322 | Tragic 71.4% |
| West Indians | 0.0 /100 | #323 | Tragic 71.3% |
| Immigrants | Dominican Republic | 0.0 /100 | #324 | Tragic 71.2% |
| Barbadians | 0.0 /100 | #325 | Tragic 71.1% |
| Dominicans | 0.0 /100 | #326 | Tragic 71.1% |
| Immigrants | Trinidad and Tobago | 0.0 /100 | #327 | Tragic 71.1% |
Demographics Similar to Immigrants from Czechoslovakia by In Labor Force | Age 20-24
In terms of in labor force | age 20-24, the demographic groups most similar to Immigrants from Czechoslovakia are Immigrants from Latvia (75.0%, a difference of 0.0%), Immigrants from Central America (75.0%, a difference of 0.010%), African (75.0%, a difference of 0.020%), Immigrants from Mexico (75.0%, a difference of 0.060%), and Central American (75.0%, a difference of 0.070%).
| Demographics | Rating | Rank | In Labor Force | Age 20-24 |
| Immigrants | Croatia | 50.2 /100 | #173 | Average 75.1% |
| South Africans | 50.0 /100 | #174 | Average 75.0% |
| Syrians | 49.5 /100 | #175 | Average 75.0% |
| Central Americans | 48.7 /100 | #176 | Average 75.0% |
| Immigrants | Mexico | 47.8 /100 | #177 | Average 75.0% |
| Immigrants | Central America | 45.0 /100 | #178 | Average 75.0% |
| Immigrants | Latvia | 44.1 /100 | #179 | Average 75.0% |
| Immigrants | Czechoslovakia | 44.0 /100 | #180 | Average 75.0% |
| Africans | 42.5 /100 | #181 | Average 75.0% |
| Immigrants | South Africa | 36.9 /100 | #182 | Fair 74.9% |
| Immigrants | Costa Rica | 36.7 /100 | #183 | Fair 74.9% |
| Immigrants | Hungary | 35.0 /100 | #184 | Fair 74.9% |
| Sri Lankans | 34.9 /100 | #185 | Fair 74.9% |
| Immigrants | Eastern Europe | 33.8 /100 | #186 | Fair 74.9% |
| Immigrants | Honduras | 33.5 /100 | #187 | Fair 74.9% |