Immigrants from Europe vs Immigrants from Czechoslovakia In Labor Force | Age 20-24
COMPARE
Immigrants from Europe
Immigrants from Czechoslovakia
In Labor Force | Age 20-24
In Labor Force | Age 20-24 Comparison
Immigrants from Europe
Immigrants from Czechoslovakia
74.8%
IN LABOR FORCE | AGE 20-24
27.5/ 100
METRIC RATING
192nd/ 347
METRIC RANK
75.0%
IN LABOR FORCE | AGE 20-24
44.0/ 100
METRIC RATING
180th/ 347
METRIC RANK
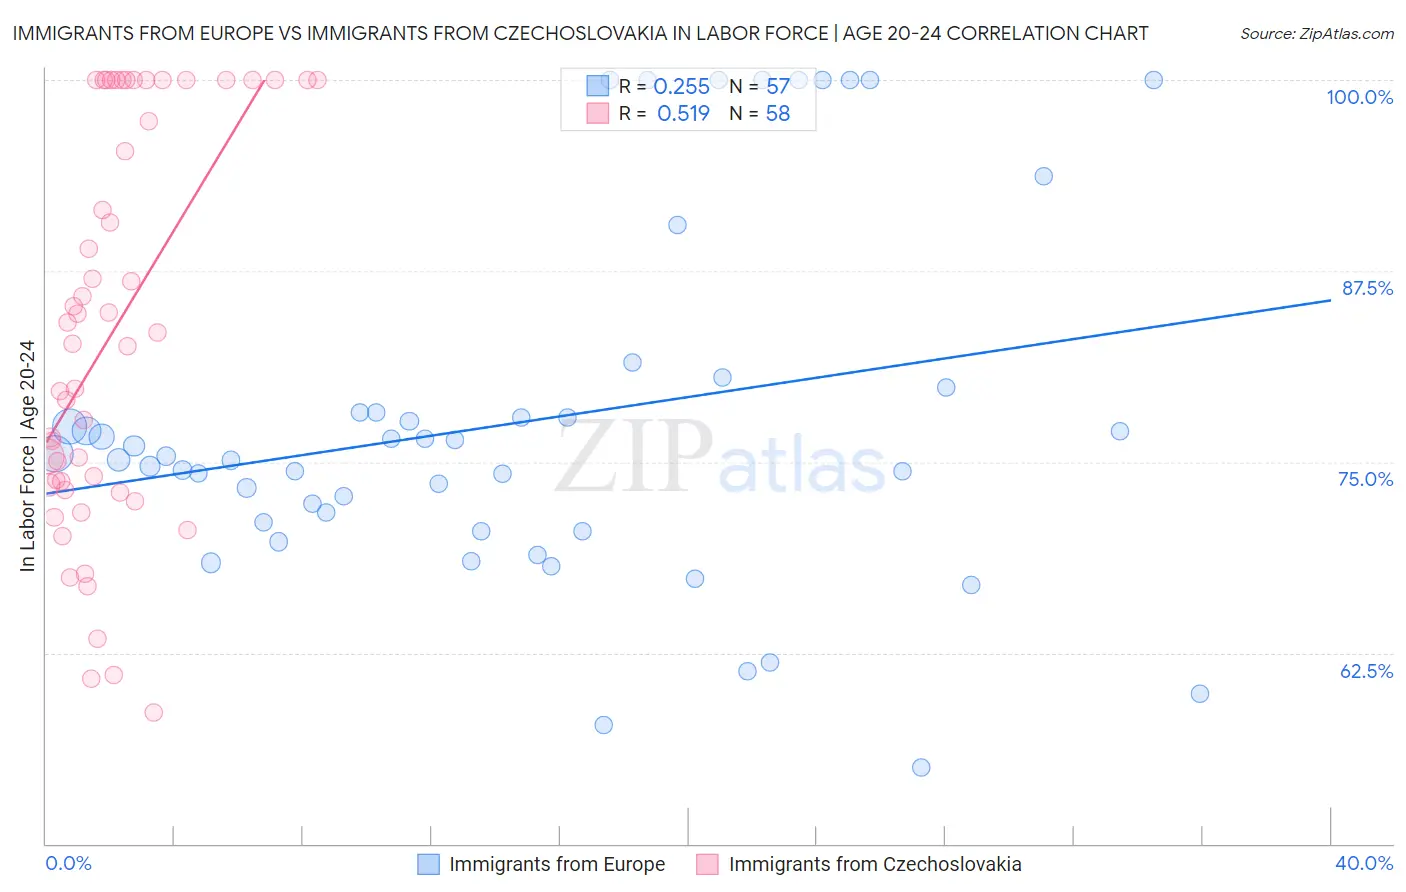
Immigrants from Europe vs Immigrants from Czechoslovakia In Labor Force | Age 20-24 Correlation Chart
The statistical analysis conducted on geographies consisting of 546,529,081 people shows a weak positive correlation between the proportion of Immigrants from Europe and labor force participation rate among population between the ages 20 and 24 in the United States with a correlation coefficient (R) of 0.255 and weighted average of 74.8%. Similarly, the statistical analysis conducted on geographies consisting of 195,383,549 people shows a substantial positive correlation between the proportion of Immigrants from Czechoslovakia and labor force participation rate among population between the ages 20 and 24 in the United States with a correlation coefficient (R) of 0.519 and weighted average of 75.0%, a difference of 0.27%.
In Labor Force | Age 20-24 Correlation Summary
| Measurement | Immigrants from Europe | Immigrants from Czechoslovakia |
| Minimum | 55.0% | 58.6% |
| Maximum | 100.0% | 100.0% |
| Range | 45.0% | 41.4% |
| Mean | 77.7% | 83.6% |
| Median | 75.4% | 83.1% |
| Interquartile 25% (IQ1) | 70.8% | 73.5% |
| Interquartile 75% (IQ3) | 79.1% | 100.0% |
| Interquartile Range (IQR) | 8.3% | 26.5% |
| Standard Deviation (Sample) | 11.7% | 12.9% |
| Standard Deviation (Population) | 11.6% | 12.8% |
Demographics Similar to Immigrants from Europe and Immigrants from Czechoslovakia by In Labor Force | Age 20-24
In terms of in labor force | age 20-24, the demographic groups most similar to Immigrants from Europe are Senegalese (74.8%, a difference of 0.010%), Alsatian (74.8%, a difference of 0.010%), Immigrants from Denmark (74.8%, a difference of 0.030%), Eastern European (74.8%, a difference of 0.040%), and Immigrants from Vietnam (74.7%, a difference of 0.050%). Similarly, the demographic groups most similar to Immigrants from Czechoslovakia are Immigrants from Latvia (75.0%, a difference of 0.0%), Immigrants from Central America (75.0%, a difference of 0.010%), African (75.0%, a difference of 0.020%), Immigrants from Mexico (75.0%, a difference of 0.060%), and Central American (75.0%, a difference of 0.070%).
| Demographics | Rating | Rank | In Labor Force | Age 20-24 |
| Central Americans | 48.7 /100 | #176 | Average 75.0% |
| Immigrants | Mexico | 47.8 /100 | #177 | Average 75.0% |
| Immigrants | Central America | 45.0 /100 | #178 | Average 75.0% |
| Immigrants | Latvia | 44.1 /100 | #179 | Average 75.0% |
| Immigrants | Czechoslovakia | 44.0 /100 | #180 | Average 75.0% |
| Africans | 42.5 /100 | #181 | Average 75.0% |
| Immigrants | South Africa | 36.9 /100 | #182 | Fair 74.9% |
| Immigrants | Costa Rica | 36.7 /100 | #183 | Fair 74.9% |
| Immigrants | Hungary | 35.0 /100 | #184 | Fair 74.9% |
| Sri Lankans | 34.9 /100 | #185 | Fair 74.9% |
| Immigrants | Eastern Europe | 33.8 /100 | #186 | Fair 74.9% |
| Immigrants | Honduras | 33.5 /100 | #187 | Fair 74.9% |
| Hondurans | 32.7 /100 | #188 | Fair 74.8% |
| Immigrants | Northern Europe | 32.6 /100 | #189 | Fair 74.8% |
| Russians | 32.2 /100 | #190 | Fair 74.8% |
| Senegalese | 28.1 /100 | #191 | Fair 74.8% |
| Immigrants | Europe | 27.5 /100 | #192 | Fair 74.8% |
| Alsatians | 27.1 /100 | #193 | Fair 74.8% |
| Immigrants | Denmark | 25.8 /100 | #194 | Fair 74.8% |
| Eastern Europeans | 25.4 /100 | #195 | Fair 74.8% |
| Immigrants | Vietnam | 25.1 /100 | #196 | Fair 74.7% |