Immigrants from El Salvador vs Immigrants from Czechoslovakia In Labor Force | Age 20-24
COMPARE
Immigrants from El Salvador
Immigrants from Czechoslovakia
In Labor Force | Age 20-24
In Labor Force | Age 20-24 Comparison
Immigrants from El Salvador
Immigrants from Czechoslovakia
75.3%
IN LABOR FORCE | AGE 20-24
71.7/ 100
METRIC RATING
156th/ 347
METRIC RANK
75.0%
IN LABOR FORCE | AGE 20-24
44.0/ 100
METRIC RATING
180th/ 347
METRIC RANK
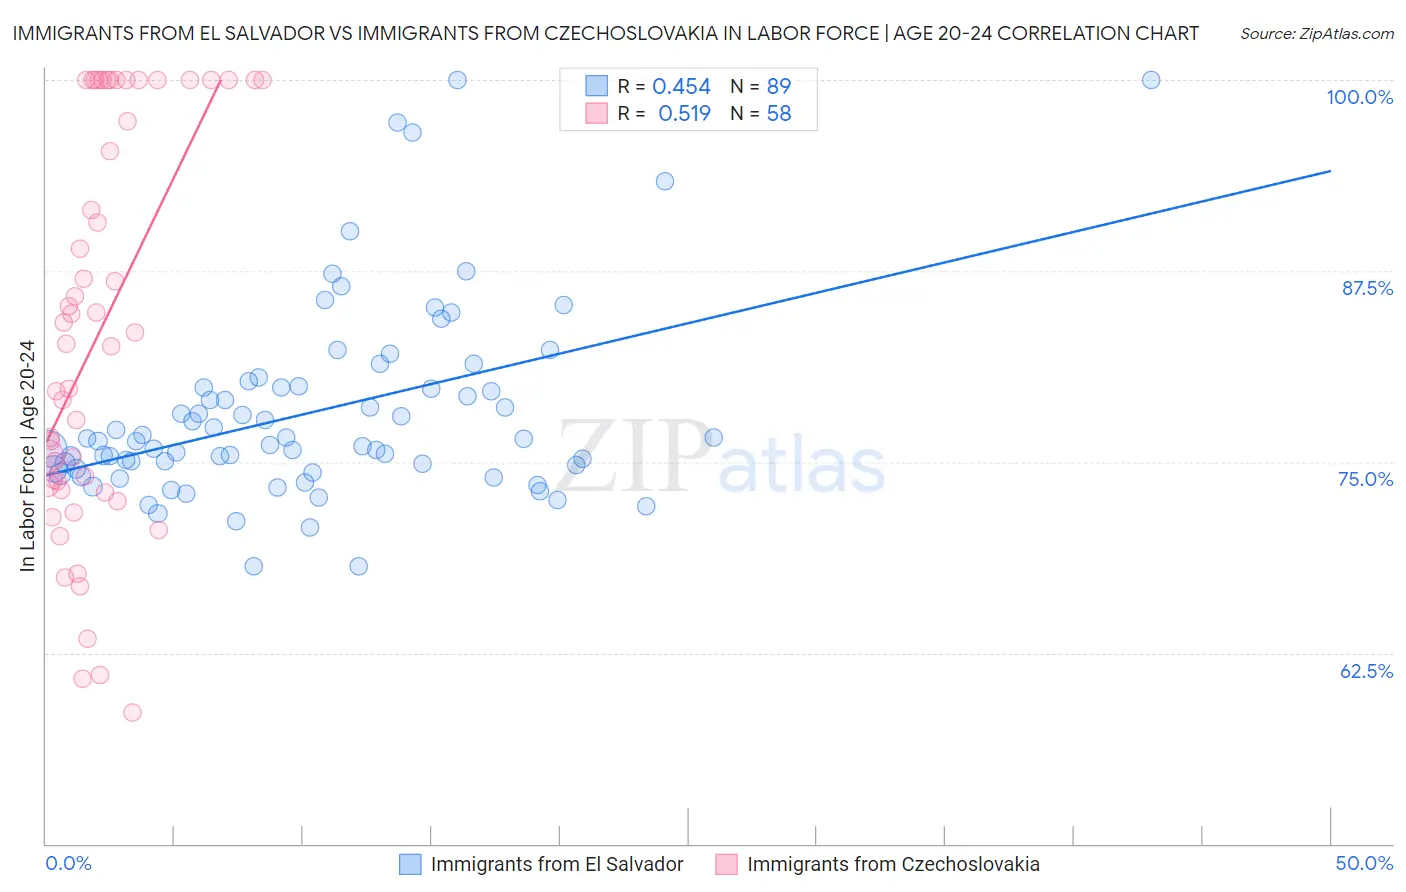
Immigrants from El Salvador vs Immigrants from Czechoslovakia In Labor Force | Age 20-24 Correlation Chart
The statistical analysis conducted on geographies consisting of 357,704,995 people shows a moderate positive correlation between the proportion of Immigrants from El Salvador and labor force participation rate among population between the ages 20 and 24 in the United States with a correlation coefficient (R) of 0.454 and weighted average of 75.3%. Similarly, the statistical analysis conducted on geographies consisting of 195,383,549 people shows a substantial positive correlation between the proportion of Immigrants from Czechoslovakia and labor force participation rate among population between the ages 20 and 24 in the United States with a correlation coefficient (R) of 0.519 and weighted average of 75.0%, a difference of 0.43%.
In Labor Force | Age 20-24 Correlation Summary
| Measurement | Immigrants from El Salvador | Immigrants from Czechoslovakia |
| Minimum | 68.1% | 58.6% |
| Maximum | 100.0% | 100.0% |
| Range | 31.9% | 41.4% |
| Mean | 78.3% | 83.6% |
| Median | 76.4% | 83.1% |
| Interquartile 25% (IQ1) | 74.5% | 73.5% |
| Interquartile 75% (IQ3) | 79.9% | 100.0% |
| Interquartile Range (IQR) | 5.4% | 26.5% |
| Standard Deviation (Sample) | 6.3% | 12.9% |
| Standard Deviation (Population) | 6.3% | 12.8% |
Similar Demographics by In Labor Force | Age 20-24
Demographics Similar to Immigrants from El Salvador by In Labor Force | Age 20-24
In terms of in labor force | age 20-24, the demographic groups most similar to Immigrants from El Salvador are Immigrants from Guatemala (75.3%, a difference of 0.0%), Immigrants from Western Europe (75.3%, a difference of 0.0%), Guatemalan (75.3%, a difference of 0.010%), Osage (75.3%, a difference of 0.010%), and Immigrants from Bolivia (75.3%, a difference of 0.010%).
| Demographics | Rating | Rank | In Labor Force | Age 20-24 |
| Ugandans | 76.1 /100 | #149 | Good 75.4% |
| Salvadorans | 74.8 /100 | #150 | Good 75.3% |
| Paiute | 74.1 /100 | #151 | Good 75.3% |
| Lebanese | 73.5 /100 | #152 | Good 75.3% |
| Guatemalans | 72.3 /100 | #153 | Good 75.3% |
| Osage | 72.3 /100 | #154 | Good 75.3% |
| Immigrants | Guatemala | 71.9 /100 | #155 | Good 75.3% |
| Immigrants | El Salvador | 71.7 /100 | #156 | Good 75.3% |
| Immigrants | Western Europe | 71.5 /100 | #157 | Good 75.3% |
| Immigrants | Bolivia | 71.0 /100 | #158 | Good 75.3% |
| South American Indians | 69.0 /100 | #159 | Good 75.3% |
| Japanese | 68.7 /100 | #160 | Good 75.3% |
| New Zealanders | 65.4 /100 | #161 | Good 75.2% |
| Immigrants | Romania | 64.6 /100 | #162 | Good 75.2% |
| Costa Ricans | 64.2 /100 | #163 | Good 75.2% |
Demographics Similar to Immigrants from Czechoslovakia by In Labor Force | Age 20-24
In terms of in labor force | age 20-24, the demographic groups most similar to Immigrants from Czechoslovakia are Immigrants from Latvia (75.0%, a difference of 0.0%), Immigrants from Central America (75.0%, a difference of 0.010%), African (75.0%, a difference of 0.020%), Immigrants from Mexico (75.0%, a difference of 0.060%), and Central American (75.0%, a difference of 0.070%).
| Demographics | Rating | Rank | In Labor Force | Age 20-24 |
| Immigrants | Croatia | 50.2 /100 | #173 | Average 75.1% |
| South Africans | 50.0 /100 | #174 | Average 75.0% |
| Syrians | 49.5 /100 | #175 | Average 75.0% |
| Central Americans | 48.7 /100 | #176 | Average 75.0% |
| Immigrants | Mexico | 47.8 /100 | #177 | Average 75.0% |
| Immigrants | Central America | 45.0 /100 | #178 | Average 75.0% |
| Immigrants | Latvia | 44.1 /100 | #179 | Average 75.0% |
| Immigrants | Czechoslovakia | 44.0 /100 | #180 | Average 75.0% |
| Africans | 42.5 /100 | #181 | Average 75.0% |
| Immigrants | South Africa | 36.9 /100 | #182 | Fair 74.9% |
| Immigrants | Costa Rica | 36.7 /100 | #183 | Fair 74.9% |
| Immigrants | Hungary | 35.0 /100 | #184 | Fair 74.9% |
| Sri Lankans | 34.9 /100 | #185 | Fair 74.9% |
| Immigrants | Eastern Europe | 33.8 /100 | #186 | Fair 74.9% |
| Immigrants | Honduras | 33.5 /100 | #187 | Fair 74.9% |