Trinidadian and Tobagonian vs Comanche In Labor Force | Age 20-24
COMPARE
Trinidadian and Tobagonian
Comanche
In Labor Force | Age 20-24
In Labor Force | Age 20-24 Comparison
Trinidadians and Tobagonians
Comanche
71.5%
IN LABOR FORCE | AGE 20-24
0.0/ 100
METRIC RATING
320th/ 347
METRIC RANK
75.4%
IN LABOR FORCE | AGE 20-24
77.6/ 100
METRIC RATING
147th/ 347
METRIC RANK
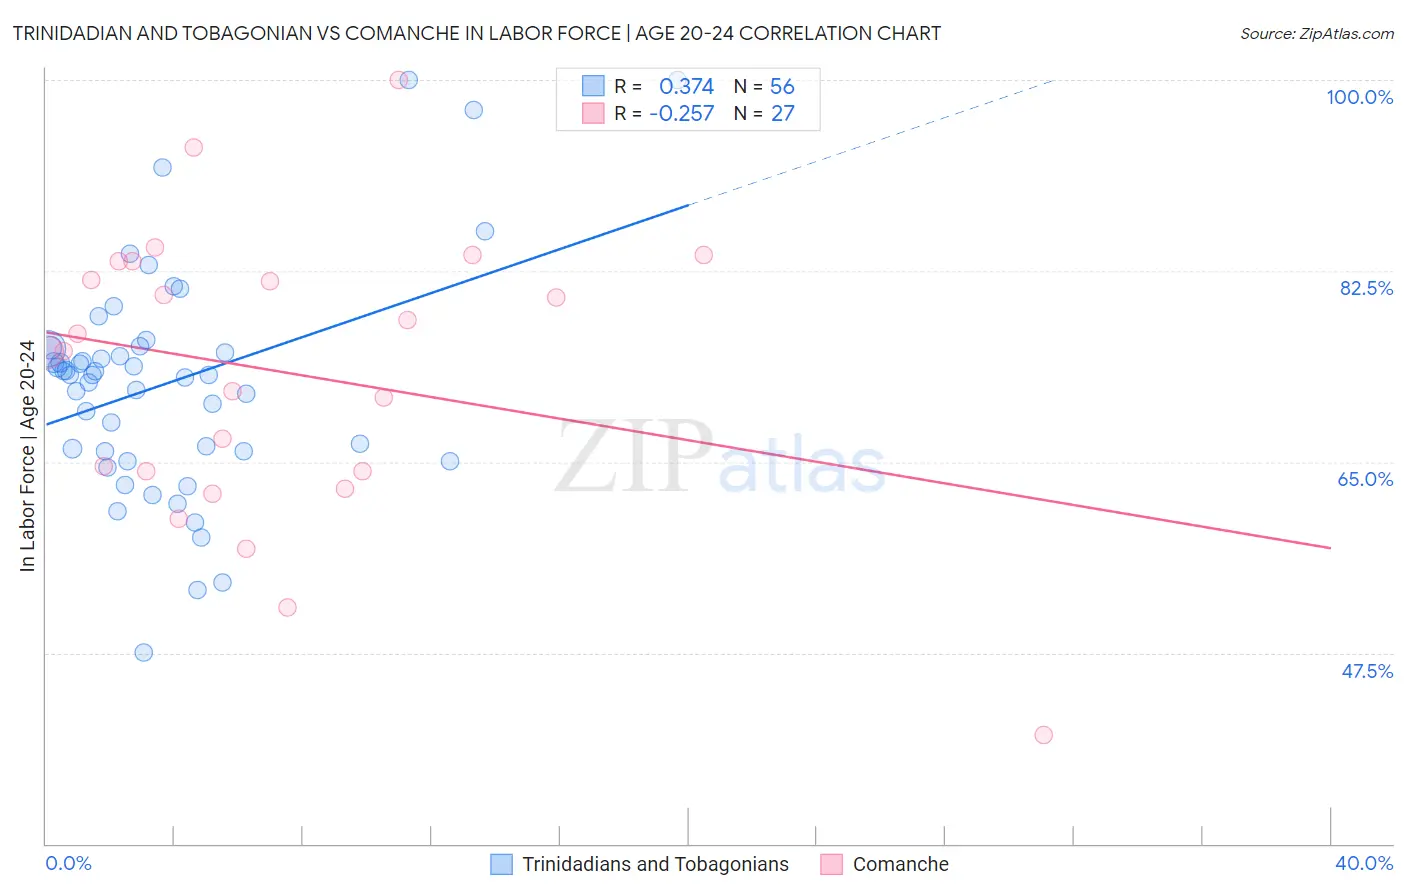
Trinidadian and Tobagonian vs Comanche In Labor Force | Age 20-24 Correlation Chart
The statistical analysis conducted on geographies consisting of 219,866,832 people shows a mild positive correlation between the proportion of Trinidadians and Tobagonians and labor force participation rate among population between the ages 20 and 24 in the United States with a correlation coefficient (R) of 0.374 and weighted average of 71.5%. Similarly, the statistical analysis conducted on geographies consisting of 109,763,066 people shows a weak negative correlation between the proportion of Comanche and labor force participation rate among population between the ages 20 and 24 in the United States with a correlation coefficient (R) of -0.257 and weighted average of 75.4%, a difference of 5.4%.
In Labor Force | Age 20-24 Correlation Summary
| Measurement | Trinidadian and Tobagonian | Comanche |
| Minimum | 47.5% | 40.0% |
| Maximum | 100.0% | 100.0% |
| Range | 52.5% | 60.0% |
| Mean | 72.3% | 73.2% |
| Median | 73.0% | 75.1% |
| Interquartile 25% (IQ1) | 66.0% | 64.1% |
| Interquartile 75% (IQ3) | 75.4% | 83.4% |
| Interquartile Range (IQR) | 9.4% | 19.3% |
| Standard Deviation (Sample) | 10.4% | 13.2% |
| Standard Deviation (Population) | 10.3% | 12.9% |
Similar Demographics by In Labor Force | Age 20-24
Demographics Similar to Trinidadians and Tobagonians by In Labor Force | Age 20-24
In terms of in labor force | age 20-24, the demographic groups most similar to Trinidadians and Tobagonians are Immigrants from Taiwan (71.5%, a difference of 0.050%), Immigrants from Israel (71.6%, a difference of 0.080%), Immigrants from Hong Kong (71.6%, a difference of 0.11%), Filipino (71.4%, a difference of 0.18%), and Immigrants from Armenia (71.7%, a difference of 0.20%).
| Demographics | Rating | Rank | In Labor Force | Age 20-24 |
| Immigrants | Dominica | 0.0 /100 | #313 | Tragic 71.9% |
| Indians (Asian) | 0.0 /100 | #314 | Tragic 71.9% |
| Immigrants | Iran | 0.0 /100 | #315 | Tragic 71.8% |
| Immigrants | Eastern Asia | 0.0 /100 | #316 | Tragic 71.8% |
| Immigrants | Armenia | 0.0 /100 | #317 | Tragic 71.7% |
| Immigrants | Hong Kong | 0.0 /100 | #318 | Tragic 71.6% |
| Immigrants | Israel | 0.0 /100 | #319 | Tragic 71.6% |
| Trinidadians and Tobagonians | 0.0 /100 | #320 | Tragic 71.5% |
| Immigrants | Taiwan | 0.0 /100 | #321 | Tragic 71.5% |
| Filipinos | 0.0 /100 | #322 | Tragic 71.4% |
| West Indians | 0.0 /100 | #323 | Tragic 71.3% |
| Immigrants | Dominican Republic | 0.0 /100 | #324 | Tragic 71.2% |
| Barbadians | 0.0 /100 | #325 | Tragic 71.1% |
| Dominicans | 0.0 /100 | #326 | Tragic 71.1% |
| Immigrants | Trinidad and Tobago | 0.0 /100 | #327 | Tragic 71.1% |
Demographics Similar to Comanche by In Labor Force | Age 20-24
In terms of in labor force | age 20-24, the demographic groups most similar to Comanche are Immigrants from Cambodia (75.4%, a difference of 0.020%), Mexican American Indian (75.4%, a difference of 0.030%), Ugandan (75.4%, a difference of 0.030%), Korean (75.4%, a difference of 0.050%), and Salvadoran (75.3%, a difference of 0.050%).
| Demographics | Rating | Rank | In Labor Force | Age 20-24 |
| Delaware | 84.5 /100 | #140 | Excellent 75.5% |
| Romanians | 84.1 /100 | #141 | Excellent 75.5% |
| Blackfeet | 83.6 /100 | #142 | Excellent 75.5% |
| Spaniards | 82.0 /100 | #143 | Excellent 75.5% |
| Bhutanese | 80.8 /100 | #144 | Excellent 75.4% |
| Koreans | 79.7 /100 | #145 | Good 75.4% |
| Mexican American Indians | 78.8 /100 | #146 | Good 75.4% |
| Comanche | 77.6 /100 | #147 | Good 75.4% |
| Immigrants | Cambodia | 76.7 /100 | #148 | Good 75.4% |
| Ugandans | 76.1 /100 | #149 | Good 75.4% |
| Salvadorans | 74.8 /100 | #150 | Good 75.3% |
| Paiute | 74.1 /100 | #151 | Good 75.3% |
| Lebanese | 73.5 /100 | #152 | Good 75.3% |
| Guatemalans | 72.3 /100 | #153 | Good 75.3% |
| Osage | 72.3 /100 | #154 | Good 75.3% |