Trinidadian and Tobagonian vs Immigrants from Czechoslovakia Bachelor's Degree
COMPARE
Trinidadian and Tobagonian
Immigrants from Czechoslovakia
Bachelor's Degree
Bachelor's Degree Comparison
Trinidadians and Tobagonians
Immigrants from Czechoslovakia
35.7%
BACHELOR'S DEGREE
8.8/ 100
METRIC RATING
222nd/ 347
METRIC RANK
44.0%
BACHELOR'S DEGREE
99.9/ 100
METRIC RATING
58th/ 347
METRIC RANK
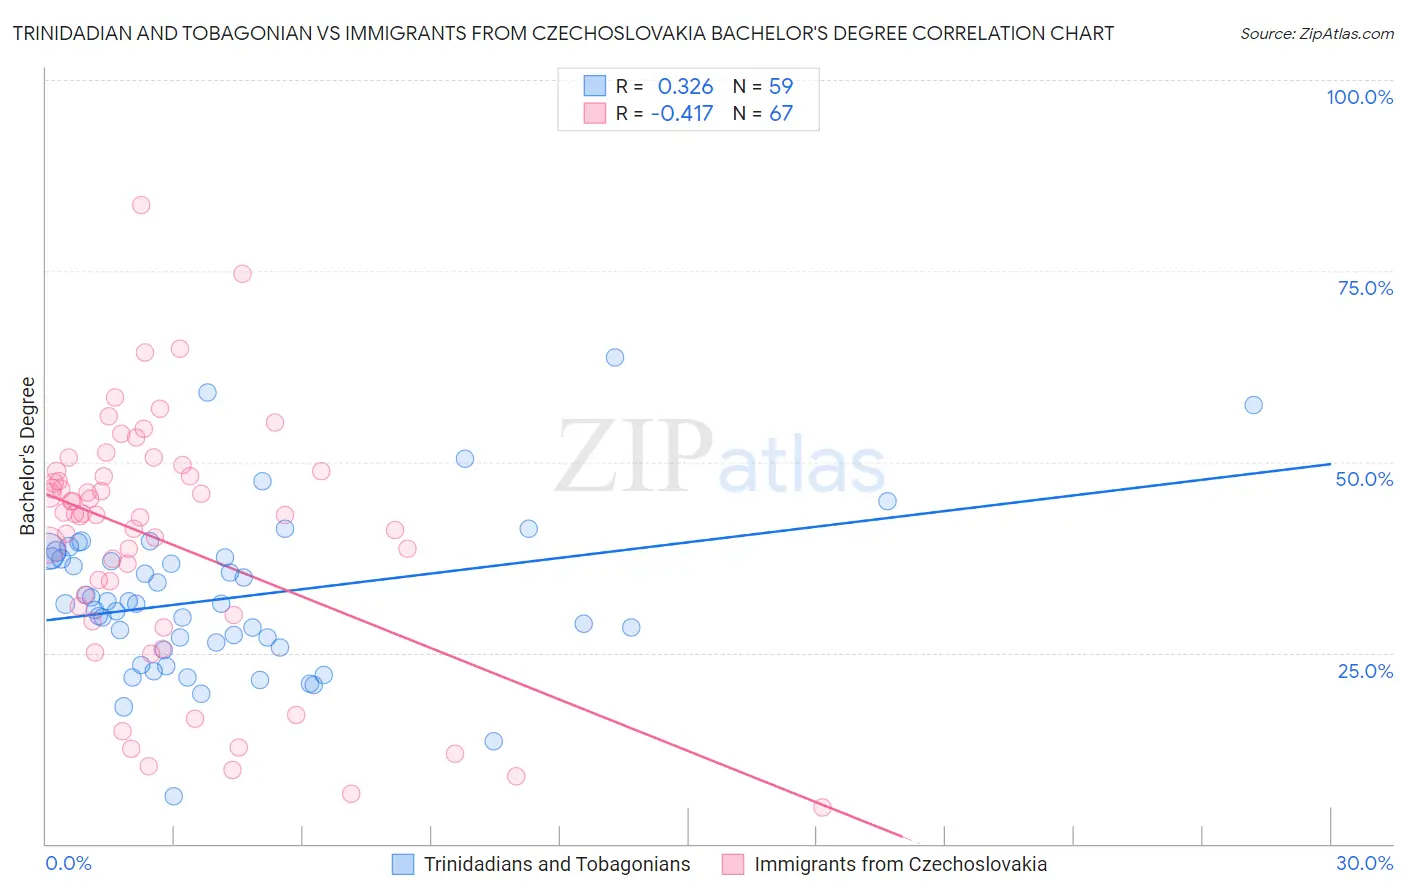
Trinidadian and Tobagonian vs Immigrants from Czechoslovakia Bachelor's Degree Correlation Chart
The statistical analysis conducted on geographies consisting of 219,852,585 people shows a mild positive correlation between the proportion of Trinidadians and Tobagonians and percentage of population with at least bachelor's degree education in the United States with a correlation coefficient (R) of 0.326 and weighted average of 35.7%. Similarly, the statistical analysis conducted on geographies consisting of 195,448,477 people shows a moderate negative correlation between the proportion of Immigrants from Czechoslovakia and percentage of population with at least bachelor's degree education in the United States with a correlation coefficient (R) of -0.417 and weighted average of 44.0%, a difference of 23.4%.
Bachelor's Degree Correlation Summary
| Measurement | Trinidadian and Tobagonian | Immigrants from Czechoslovakia |
| Minimum | 6.2% | 4.8% |
| Maximum | 63.7% | 83.6% |
| Range | 57.5% | 78.9% |
| Mean | 32.2% | 39.6% |
| Median | 31.4% | 43.1% |
| Interquartile 25% (IQ1) | 25.6% | 29.9% |
| Interquartile 75% (IQ3) | 37.5% | 48.7% |
| Interquartile Range (IQR) | 11.9% | 18.8% |
| Standard Deviation (Sample) | 10.4% | 16.3% |
| Standard Deviation (Population) | 10.4% | 16.2% |
Similar Demographics by Bachelor's Degree
Demographics Similar to Trinidadians and Tobagonians by Bachelor's Degree
In terms of bachelor's degree, the demographic groups most similar to Trinidadians and Tobagonians are Dutch (35.7%, a difference of 0.14%), French Canadian (35.6%, a difference of 0.18%), Spanish (35.8%, a difference of 0.25%), West Indian (35.8%, a difference of 0.29%), and Subsaharan African (35.8%, a difference of 0.32%).
| Demographics | Rating | Rank | Bachelor's Degree |
| Immigrants | Western Africa | 13.8 /100 | #215 | Poor 36.1% |
| Barbadians | 13.5 /100 | #216 | Poor 36.1% |
| German Russians | 10.2 /100 | #217 | Poor 35.8% |
| Sub-Saharan Africans | 9.8 /100 | #218 | Tragic 35.8% |
| West Indians | 9.7 /100 | #219 | Tragic 35.8% |
| Spanish | 9.6 /100 | #220 | Tragic 35.8% |
| Dutch | 9.2 /100 | #221 | Tragic 35.7% |
| Trinidadians and Tobagonians | 8.8 /100 | #222 | Tragic 35.7% |
| French Canadians | 8.3 /100 | #223 | Tragic 35.6% |
| Immigrants | Barbados | 7.5 /100 | #224 | Tragic 35.5% |
| Immigrants | Burma/Myanmar | 7.3 /100 | #225 | Tragic 35.5% |
| Portuguese | 7.2 /100 | #226 | Tragic 35.5% |
| Ecuadorians | 6.6 /100 | #227 | Tragic 35.4% |
| Immigrants | Trinidad and Tobago | 6.0 /100 | #228 | Tragic 35.3% |
| Whites/Caucasians | 5.9 /100 | #229 | Tragic 35.3% |
Demographics Similar to Immigrants from Czechoslovakia by Bachelor's Degree
In terms of bachelor's degree, the demographic groups most similar to Immigrants from Czechoslovakia are Paraguayan (44.0%, a difference of 0.050%), Australian (44.0%, a difference of 0.10%), New Zealander (44.0%, a difference of 0.11%), Immigrants from Serbia (44.1%, a difference of 0.24%), and Immigrants from Bolivia (44.2%, a difference of 0.42%).
| Demographics | Rating | Rank | Bachelor's Degree |
| Asians | 99.9 /100 | #51 | Exceptional 44.4% |
| Immigrants | Spain | 99.9 /100 | #52 | Exceptional 44.3% |
| Immigrants | Asia | 99.9 /100 | #53 | Exceptional 44.3% |
| Immigrants | Austria | 99.9 /100 | #54 | Exceptional 44.2% |
| Immigrants | Bolivia | 99.9 /100 | #55 | Exceptional 44.2% |
| Immigrants | Serbia | 99.9 /100 | #56 | Exceptional 44.1% |
| Paraguayans | 99.9 /100 | #57 | Exceptional 44.0% |
| Immigrants | Czechoslovakia | 99.9 /100 | #58 | Exceptional 44.0% |
| Australians | 99.9 /100 | #59 | Exceptional 44.0% |
| New Zealanders | 99.9 /100 | #60 | Exceptional 44.0% |
| South Africans | 99.8 /100 | #61 | Exceptional 43.6% |
| Immigrants | Kazakhstan | 99.8 /100 | #62 | Exceptional 43.4% |
| Immigrants | Europe | 99.8 /100 | #63 | Exceptional 43.4% |
| Argentineans | 99.7 /100 | #64 | Exceptional 43.3% |
| Zimbabweans | 99.7 /100 | #65 | Exceptional 43.3% |