Immigrants from Pakistan vs Comanche In Labor Force | Age 20-24
COMPARE
Immigrants from Pakistan
Comanche
In Labor Force | Age 20-24
In Labor Force | Age 20-24 Comparison
Immigrants from Pakistan
Comanche
73.8%
IN LABOR FORCE | AGE 20-24
0.9/ 100
METRIC RATING
255th/ 347
METRIC RANK
75.4%
IN LABOR FORCE | AGE 20-24
77.6/ 100
METRIC RATING
147th/ 347
METRIC RANK
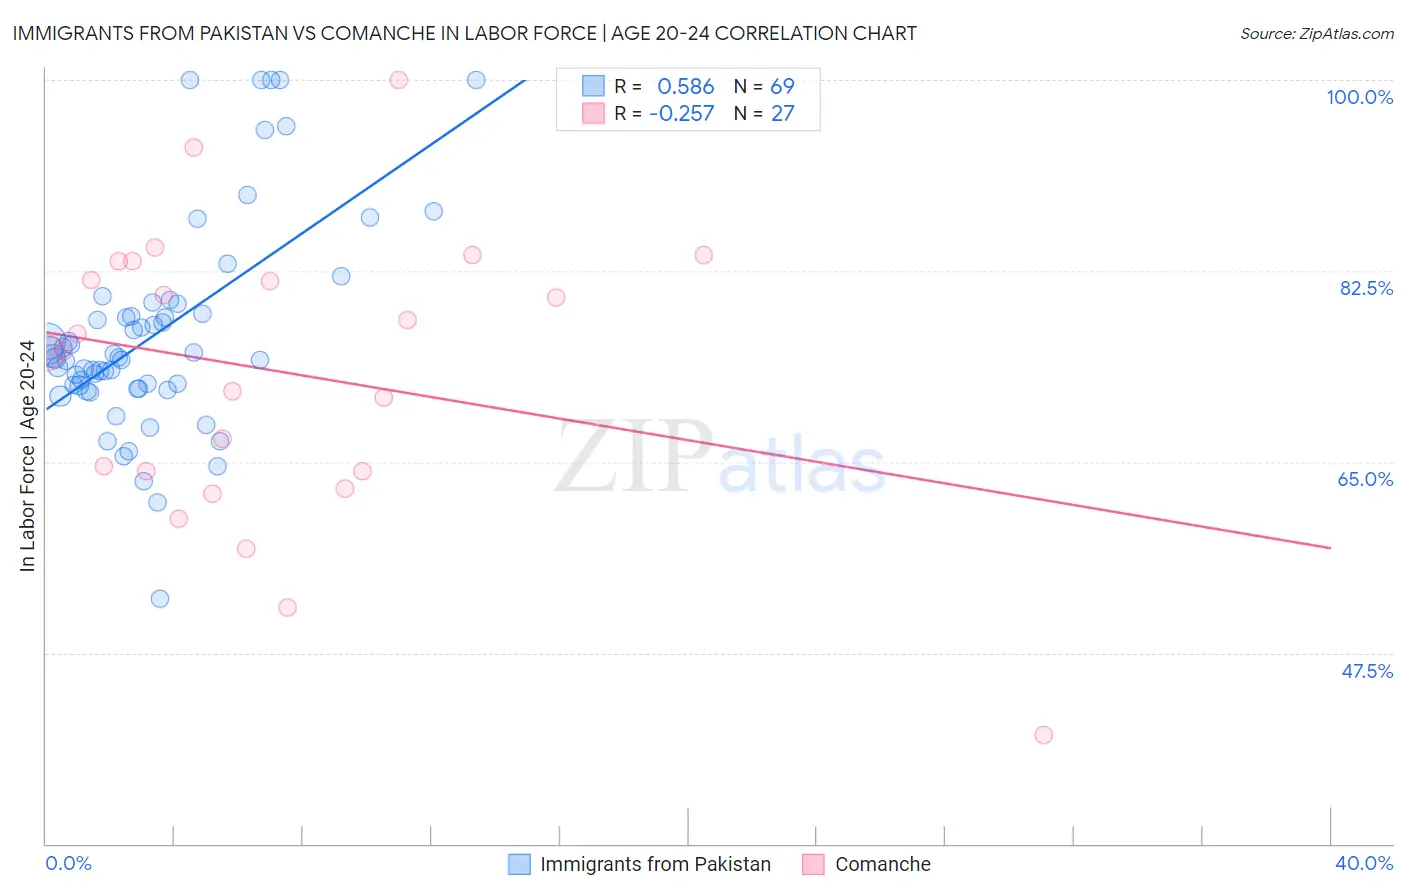
Immigrants from Pakistan vs Comanche In Labor Force | Age 20-24 Correlation Chart
The statistical analysis conducted on geographies consisting of 283,855,002 people shows a substantial positive correlation between the proportion of Immigrants from Pakistan and labor force participation rate among population between the ages 20 and 24 in the United States with a correlation coefficient (R) of 0.586 and weighted average of 73.8%. Similarly, the statistical analysis conducted on geographies consisting of 109,763,066 people shows a weak negative correlation between the proportion of Comanche and labor force participation rate among population between the ages 20 and 24 in the United States with a correlation coefficient (R) of -0.257 and weighted average of 75.4%, a difference of 2.2%.
In Labor Force | Age 20-24 Correlation Summary
| Measurement | Immigrants from Pakistan | Comanche |
| Minimum | 52.5% | 40.0% |
| Maximum | 100.0% | 100.0% |
| Range | 47.5% | 60.0% |
| Mean | 76.7% | 73.2% |
| Median | 74.6% | 75.1% |
| Interquartile 25% (IQ1) | 71.9% | 64.1% |
| Interquartile 75% (IQ3) | 79.0% | 83.4% |
| Interquartile Range (IQR) | 7.2% | 19.3% |
| Standard Deviation (Sample) | 9.6% | 13.2% |
| Standard Deviation (Population) | 9.5% | 12.9% |
Similar Demographics by In Labor Force | Age 20-24
Demographics Similar to Immigrants from Pakistan by In Labor Force | Age 20-24
In terms of in labor force | age 20-24, the demographic groups most similar to Immigrants from Pakistan are Ute (73.8%, a difference of 0.020%), Arapaho (73.8%, a difference of 0.030%), Spanish American Indian (73.7%, a difference of 0.040%), Paraguayan (73.7%, a difference of 0.060%), and Immigrants from Kazakhstan (73.8%, a difference of 0.070%).
| Demographics | Rating | Rank | In Labor Force | Age 20-24 |
| Immigrants | Saudi Arabia | 1.5 /100 | #248 | Tragic 73.9% |
| Blacks/African Americans | 1.3 /100 | #249 | Tragic 73.9% |
| Immigrants | Belgium | 1.3 /100 | #250 | Tragic 73.9% |
| Immigrants | Egypt | 1.2 /100 | #251 | Tragic 73.8% |
| Immigrants | Kazakhstan | 1.1 /100 | #252 | Tragic 73.8% |
| Arapaho | 1.0 /100 | #253 | Tragic 73.8% |
| Ute | 1.0 /100 | #254 | Tragic 73.8% |
| Immigrants | Pakistan | 0.9 /100 | #255 | Tragic 73.8% |
| Spanish American Indians | 0.8 /100 | #256 | Tragic 73.7% |
| Paraguayans | 0.8 /100 | #257 | Tragic 73.7% |
| Egyptians | 0.7 /100 | #258 | Tragic 73.7% |
| Dutch West Indians | 0.7 /100 | #259 | Tragic 73.7% |
| Immigrants | Turkey | 0.7 /100 | #260 | Tragic 73.7% |
| Houma | 0.6 /100 | #261 | Tragic 73.7% |
| Asians | 0.6 /100 | #262 | Tragic 73.7% |
Demographics Similar to Comanche by In Labor Force | Age 20-24
In terms of in labor force | age 20-24, the demographic groups most similar to Comanche are Immigrants from Cambodia (75.4%, a difference of 0.020%), Mexican American Indian (75.4%, a difference of 0.030%), Ugandan (75.4%, a difference of 0.030%), Korean (75.4%, a difference of 0.050%), and Salvadoran (75.3%, a difference of 0.050%).
| Demographics | Rating | Rank | In Labor Force | Age 20-24 |
| Delaware | 84.5 /100 | #140 | Excellent 75.5% |
| Romanians | 84.1 /100 | #141 | Excellent 75.5% |
| Blackfeet | 83.6 /100 | #142 | Excellent 75.5% |
| Spaniards | 82.0 /100 | #143 | Excellent 75.5% |
| Bhutanese | 80.8 /100 | #144 | Excellent 75.4% |
| Koreans | 79.7 /100 | #145 | Good 75.4% |
| Mexican American Indians | 78.8 /100 | #146 | Good 75.4% |
| Comanche | 77.6 /100 | #147 | Good 75.4% |
| Immigrants | Cambodia | 76.7 /100 | #148 | Good 75.4% |
| Ugandans | 76.1 /100 | #149 | Good 75.4% |
| Salvadorans | 74.8 /100 | #150 | Good 75.3% |
| Paiute | 74.1 /100 | #151 | Good 75.3% |
| Lebanese | 73.5 /100 | #152 | Good 75.3% |
| Guatemalans | 72.3 /100 | #153 | Good 75.3% |
| Osage | 72.3 /100 | #154 | Good 75.3% |