Tongan vs Immigrants from Colombia In Labor Force | Age 35-44
COMPARE
Tongan
Immigrants from Colombia
In Labor Force | Age 35-44
In Labor Force | Age 35-44 Comparison
Tongans
Immigrants from Colombia
83.6%
IN LABOR FORCE | AGE 35-44
0.4/ 100
METRIC RATING
254th/ 347
METRIC RANK
84.9%
IN LABOR FORCE | AGE 35-44
98.3/ 100
METRIC RATING
80th/ 347
METRIC RANK
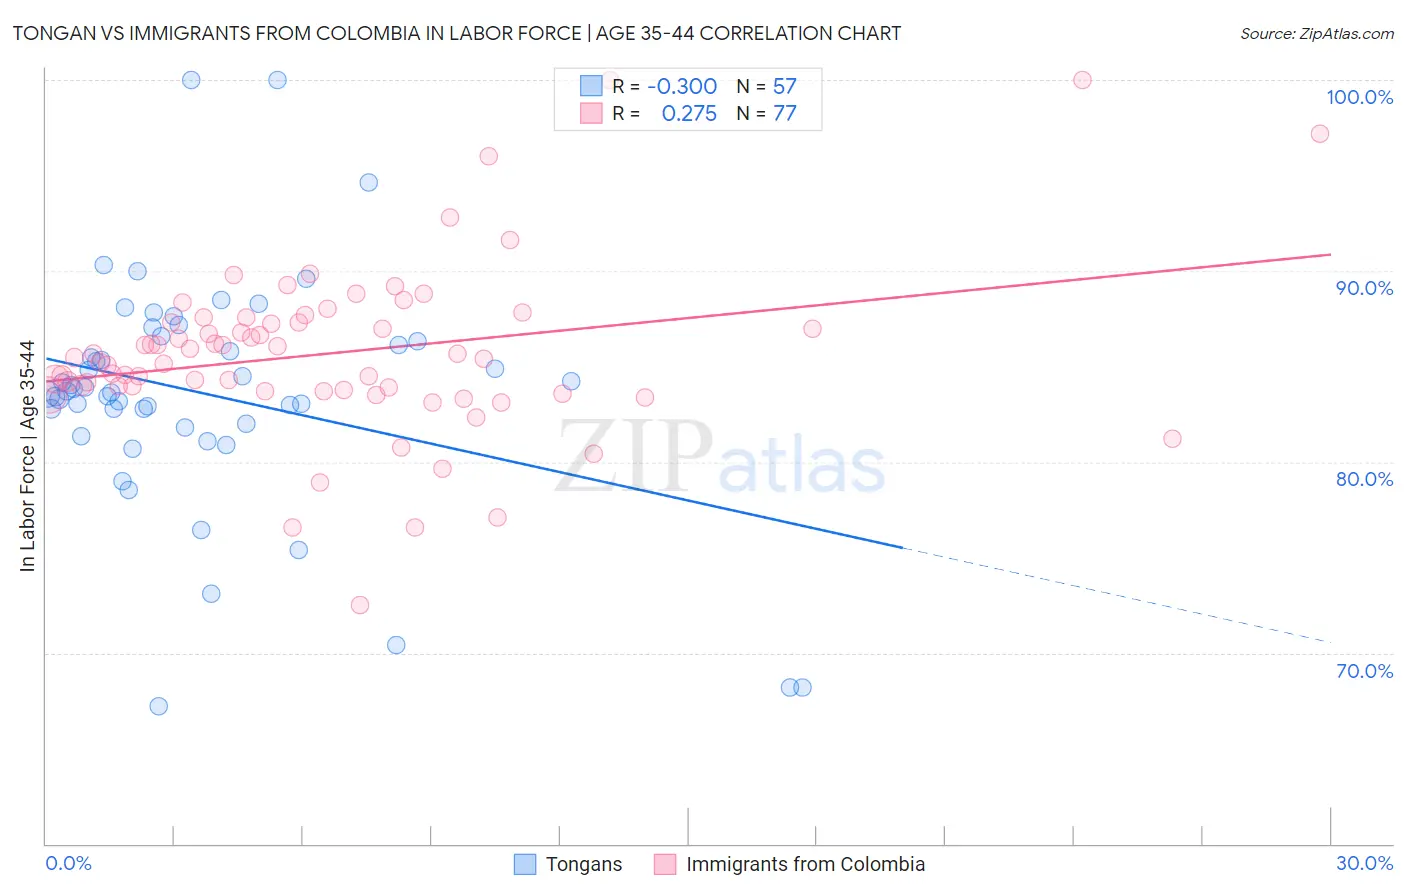
Tongan vs Immigrants from Colombia In Labor Force | Age 35-44 Correlation Chart
The statistical analysis conducted on geographies consisting of 102,881,959 people shows a mild negative correlation between the proportion of Tongans and labor force participation rate among population between the ages 35 and 44 in the United States with a correlation coefficient (R) of -0.300 and weighted average of 83.6%. Similarly, the statistical analysis conducted on geographies consisting of 378,571,639 people shows a weak positive correlation between the proportion of Immigrants from Colombia and labor force participation rate among population between the ages 35 and 44 in the United States with a correlation coefficient (R) of 0.275 and weighted average of 84.9%, a difference of 1.6%.
In Labor Force | Age 35-44 Correlation Summary
| Measurement | Tongan | Immigrants from Colombia |
| Minimum | 67.2% | 72.5% |
| Maximum | 100.0% | 100.0% |
| Range | 32.8% | 27.5% |
| Mean | 83.6% | 85.7% |
| Median | 83.7% | 85.5% |
| Interquartile 25% (IQ1) | 81.9% | 83.8% |
| Interquartile 75% (IQ3) | 86.4% | 87.4% |
| Interquartile Range (IQR) | 4.6% | 3.7% |
| Standard Deviation (Sample) | 6.2% | 4.5% |
| Standard Deviation (Population) | 6.2% | 4.4% |
Similar Demographics by In Labor Force | Age 35-44
Demographics Similar to Tongans by In Labor Force | Age 35-44
In terms of in labor force | age 35-44, the demographic groups most similar to Tongans are Salvadoran (83.6%, a difference of 0.010%), Immigrants from Guyana (83.6%, a difference of 0.010%), Lebanese (83.6%, a difference of 0.010%), White/Caucasian (83.6%, a difference of 0.030%), and Immigrants from the Azores (83.6%, a difference of 0.030%).
| Demographics | Rating | Rank | In Labor Force | Age 35-44 |
| Immigrants | Armenia | 0.9 /100 | #247 | Tragic 83.7% |
| Indonesians | 0.8 /100 | #248 | Tragic 83.7% |
| Immigrants | St. Vincent and the Grenadines | 0.7 /100 | #249 | Tragic 83.7% |
| Whites/Caucasians | 0.5 /100 | #250 | Tragic 83.6% |
| Salvadorans | 0.4 /100 | #251 | Tragic 83.6% |
| Immigrants | Guyana | 0.4 /100 | #252 | Tragic 83.6% |
| Lebanese | 0.4 /100 | #253 | Tragic 83.6% |
| Tongans | 0.4 /100 | #254 | Tragic 83.6% |
| Immigrants | Azores | 0.3 /100 | #255 | Tragic 83.6% |
| Japanese | 0.3 /100 | #256 | Tragic 83.6% |
| Basques | 0.3 /100 | #257 | Tragic 83.6% |
| Tsimshian | 0.2 /100 | #258 | Tragic 83.5% |
| Immigrants | El Salvador | 0.2 /100 | #259 | Tragic 83.5% |
| Vietnamese | 0.2 /100 | #260 | Tragic 83.5% |
| Immigrants | Dominica | 0.2 /100 | #261 | Tragic 83.5% |
Demographics Similar to Immigrants from Colombia by In Labor Force | Age 35-44
In terms of in labor force | age 35-44, the demographic groups most similar to Immigrants from Colombia are Peruvian (84.9%, a difference of 0.0%), Immigrants from Eastern Europe (84.9%, a difference of 0.0%), Immigrants from Africa (84.9%, a difference of 0.010%), Immigrants from Sudan (84.9%, a difference of 0.020%), and Immigrants from Cuba (84.9%, a difference of 0.030%).
| Demographics | Rating | Rank | In Labor Force | Age 35-44 |
| Immigrants | Sri Lanka | 98.9 /100 | #73 | Exceptional 85.0% |
| Colombians | 98.8 /100 | #74 | Exceptional 85.0% |
| Immigrants | South Central Asia | 98.7 /100 | #75 | Exceptional 85.0% |
| Immigrants | Cuba | 98.6 /100 | #76 | Exceptional 84.9% |
| Immigrants | Turkey | 98.6 /100 | #77 | Exceptional 84.9% |
| Immigrants | Africa | 98.4 /100 | #78 | Exceptional 84.9% |
| Peruvians | 98.3 /100 | #79 | Exceptional 84.9% |
| Immigrants | Colombia | 98.3 /100 | #80 | Exceptional 84.9% |
| Immigrants | Eastern Europe | 98.3 /100 | #81 | Exceptional 84.9% |
| Immigrants | Sudan | 98.1 /100 | #82 | Exceptional 84.9% |
| Senegalese | 97.8 /100 | #83 | Exceptional 84.9% |
| Immigrants | Peru | 97.8 /100 | #84 | Exceptional 84.9% |
| Immigrants | Middle Africa | 97.8 /100 | #85 | Exceptional 84.9% |
| Greeks | 97.8 /100 | #86 | Exceptional 84.9% |
| Belgians | 97.7 /100 | #87 | Exceptional 84.9% |