Tongan vs Albanian In Labor Force | Age 35-44
COMPARE
Tongan
Albanian
In Labor Force | Age 35-44
In Labor Force | Age 35-44 Comparison
Tongans
Albanians
83.6%
IN LABOR FORCE | AGE 35-44
0.4/ 100
METRIC RATING
254th/ 347
METRIC RANK
85.1%
IN LABOR FORCE | AGE 35-44
99.4/ 100
METRIC RATING
60th/ 347
METRIC RANK
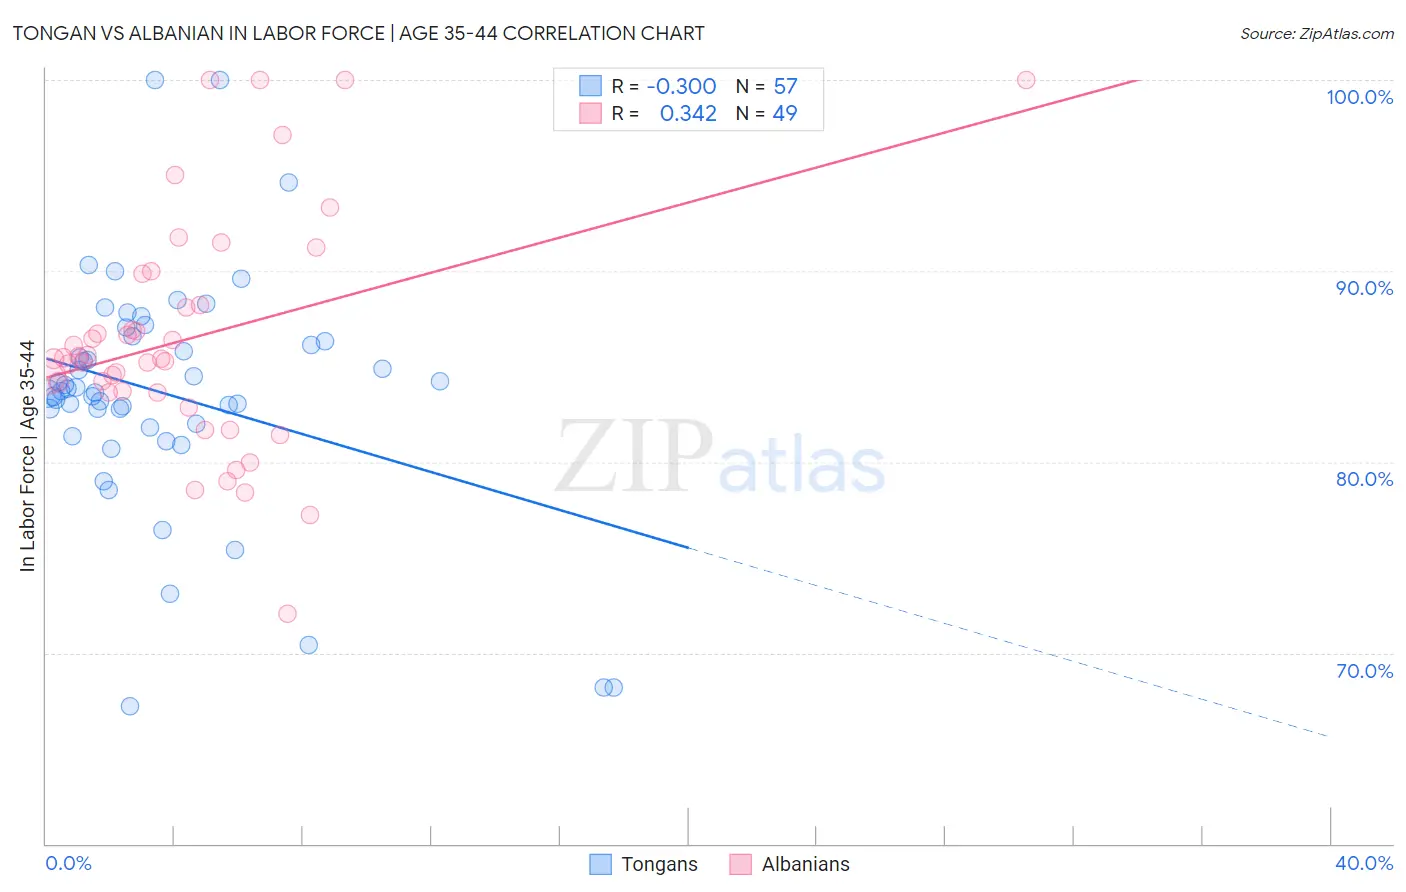
Tongan vs Albanian In Labor Force | Age 35-44 Correlation Chart
The statistical analysis conducted on geographies consisting of 102,881,959 people shows a mild negative correlation between the proportion of Tongans and labor force participation rate among population between the ages 35 and 44 in the United States with a correlation coefficient (R) of -0.300 and weighted average of 83.6%. Similarly, the statistical analysis conducted on geographies consisting of 193,210,440 people shows a mild positive correlation between the proportion of Albanians and labor force participation rate among population between the ages 35 and 44 in the United States with a correlation coefficient (R) of 0.342 and weighted average of 85.1%, a difference of 1.7%.
In Labor Force | Age 35-44 Correlation Summary
| Measurement | Tongan | Albanian |
| Minimum | 67.2% | 72.1% |
| Maximum | 100.0% | 100.0% |
| Range | 32.8% | 27.9% |
| Mean | 83.6% | 86.4% |
| Median | 83.7% | 85.4% |
| Interquartile 25% (IQ1) | 81.9% | 83.6% |
| Interquartile 75% (IQ3) | 86.4% | 89.0% |
| Interquartile Range (IQR) | 4.6% | 5.4% |
| Standard Deviation (Sample) | 6.2% | 6.1% |
| Standard Deviation (Population) | 6.2% | 6.0% |
Similar Demographics by In Labor Force | Age 35-44
Demographics Similar to Tongans by In Labor Force | Age 35-44
In terms of in labor force | age 35-44, the demographic groups most similar to Tongans are Salvadoran (83.6%, a difference of 0.010%), Immigrants from Guyana (83.6%, a difference of 0.010%), Lebanese (83.6%, a difference of 0.010%), White/Caucasian (83.6%, a difference of 0.030%), and Immigrants from the Azores (83.6%, a difference of 0.030%).
| Demographics | Rating | Rank | In Labor Force | Age 35-44 |
| Immigrants | Armenia | 0.9 /100 | #247 | Tragic 83.7% |
| Indonesians | 0.8 /100 | #248 | Tragic 83.7% |
| Immigrants | St. Vincent and the Grenadines | 0.7 /100 | #249 | Tragic 83.7% |
| Whites/Caucasians | 0.5 /100 | #250 | Tragic 83.6% |
| Salvadorans | 0.4 /100 | #251 | Tragic 83.6% |
| Immigrants | Guyana | 0.4 /100 | #252 | Tragic 83.6% |
| Lebanese | 0.4 /100 | #253 | Tragic 83.6% |
| Tongans | 0.4 /100 | #254 | Tragic 83.6% |
| Immigrants | Azores | 0.3 /100 | #255 | Tragic 83.6% |
| Japanese | 0.3 /100 | #256 | Tragic 83.6% |
| Basques | 0.3 /100 | #257 | Tragic 83.6% |
| Tsimshian | 0.2 /100 | #258 | Tragic 83.5% |
| Immigrants | El Salvador | 0.2 /100 | #259 | Tragic 83.5% |
| Vietnamese | 0.2 /100 | #260 | Tragic 83.5% |
| Immigrants | Dominica | 0.2 /100 | #261 | Tragic 83.5% |
Demographics Similar to Albanians by In Labor Force | Age 35-44
In terms of in labor force | age 35-44, the demographic groups most similar to Albanians are Serbian (85.1%, a difference of 0.0%), Chinese (85.1%, a difference of 0.010%), Slovak (85.1%, a difference of 0.010%), Immigrants from Latvia (85.0%, a difference of 0.020%), and Immigrants from Moldova (85.0%, a difference of 0.020%).
| Demographics | Rating | Rank | In Labor Force | Age 35-44 |
| Taiwanese | 99.6 /100 | #53 | Exceptional 85.1% |
| Turks | 99.5 /100 | #54 | Exceptional 85.1% |
| Soviet Union | 99.5 /100 | #55 | Exceptional 85.1% |
| Immigrants | Croatia | 99.5 /100 | #56 | Exceptional 85.1% |
| Chinese | 99.4 /100 | #57 | Exceptional 85.1% |
| Slovaks | 99.4 /100 | #58 | Exceptional 85.1% |
| Serbians | 99.4 /100 | #59 | Exceptional 85.1% |
| Albanians | 99.4 /100 | #60 | Exceptional 85.1% |
| Immigrants | Latvia | 99.3 /100 | #61 | Exceptional 85.0% |
| Immigrants | Moldova | 99.3 /100 | #62 | Exceptional 85.0% |
| Immigrants | Uganda | 99.3 /100 | #63 | Exceptional 85.0% |
| Swedes | 99.2 /100 | #64 | Exceptional 85.0% |
| Immigrants | Brazil | 99.2 /100 | #65 | Exceptional 85.0% |
| Immigrants | Haiti | 99.1 /100 | #66 | Exceptional 85.0% |
| Immigrants | Italy | 99.1 /100 | #67 | Exceptional 85.0% |