Syrian vs Albanian In Labor Force | Age 35-44
COMPARE
Syrian
Albanian
In Labor Force | Age 35-44
In Labor Force | Age 35-44 Comparison
Syrians
Albanians
84.2%
IN LABOR FORCE | AGE 35-44
23.2/ 100
METRIC RATING
199th/ 347
METRIC RANK
85.1%
IN LABOR FORCE | AGE 35-44
99.4/ 100
METRIC RATING
60th/ 347
METRIC RANK
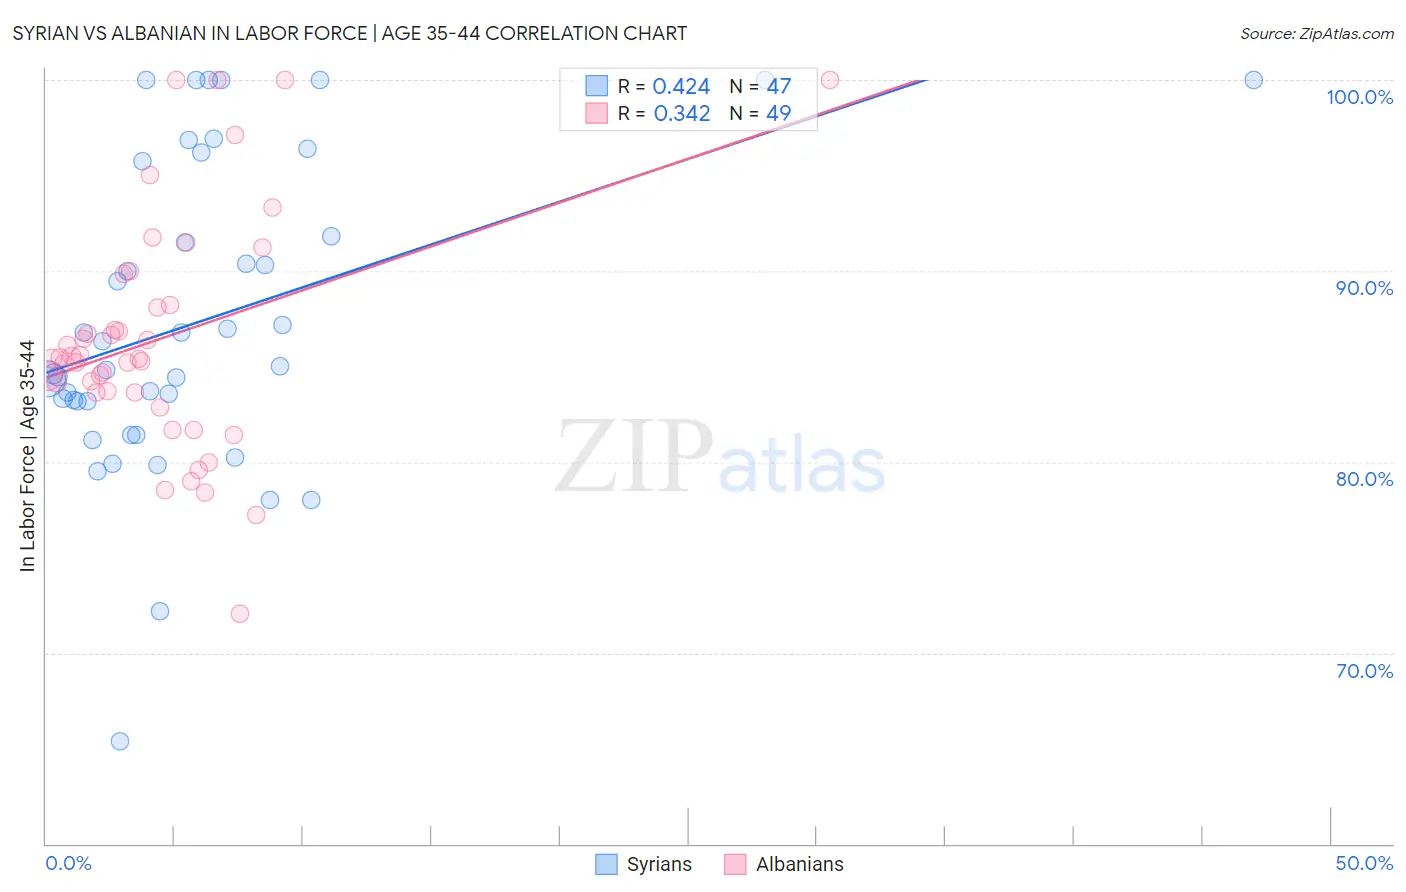
Syrian vs Albanian In Labor Force | Age 35-44 Correlation Chart
The statistical analysis conducted on geographies consisting of 266,205,393 people shows a moderate positive correlation between the proportion of Syrians and labor force participation rate among population between the ages 35 and 44 in the United States with a correlation coefficient (R) of 0.424 and weighted average of 84.2%. Similarly, the statistical analysis conducted on geographies consisting of 193,210,440 people shows a mild positive correlation between the proportion of Albanians and labor force participation rate among population between the ages 35 and 44 in the United States with a correlation coefficient (R) of 0.342 and weighted average of 85.1%, a difference of 1.0%.
In Labor Force | Age 35-44 Correlation Summary
| Measurement | Syrian | Albanian |
| Minimum | 65.3% | 72.1% |
| Maximum | 100.0% | 100.0% |
| Range | 34.7% | 27.9% |
| Mean | 87.4% | 86.4% |
| Median | 85.0% | 85.4% |
| Interquartile 25% (IQ1) | 83.2% | 83.6% |
| Interquartile 75% (IQ3) | 95.7% | 89.0% |
| Interquartile Range (IQR) | 12.6% | 5.4% |
| Standard Deviation (Sample) | 8.0% | 6.1% |
| Standard Deviation (Population) | 8.0% | 6.0% |
Similar Demographics by In Labor Force | Age 35-44
Demographics Similar to Syrians by In Labor Force | Age 35-44
In terms of in labor force | age 35-44, the demographic groups most similar to Syrians are Moroccan (84.2%, a difference of 0.0%), British (84.2%, a difference of 0.0%), Immigrants from Uzbekistan (84.2%, a difference of 0.0%), Immigrants from Western Europe (84.2%, a difference of 0.010%), and Ecuadorian (84.2%, a difference of 0.010%).
| Demographics | Rating | Rank | In Labor Force | Age 35-44 |
| Immigrants | Vietnam | 27.4 /100 | #192 | Fair 84.2% |
| Hungarians | 26.8 /100 | #193 | Fair 84.2% |
| Immigrants | Indonesia | 25.7 /100 | #194 | Fair 84.2% |
| Immigrants | Caribbean | 25.7 /100 | #195 | Fair 84.2% |
| Immigrants | England | 25.0 /100 | #196 | Fair 84.2% |
| Immigrants | Western Europe | 24.7 /100 | #197 | Fair 84.2% |
| Ecuadorians | 24.0 /100 | #198 | Fair 84.2% |
| Syrians | 23.2 /100 | #199 | Fair 84.2% |
| Moroccans | 23.2 /100 | #200 | Fair 84.2% |
| British | 23.0 /100 | #201 | Fair 84.2% |
| Immigrants | Uzbekistan | 22.8 /100 | #202 | Fair 84.2% |
| Immigrants | South Eastern Asia | 22.4 /100 | #203 | Fair 84.2% |
| Canadians | 19.9 /100 | #204 | Poor 84.2% |
| Immigrants | Canada | 19.6 /100 | #205 | Poor 84.2% |
| Immigrants | Costa Rica | 19.5 /100 | #206 | Poor 84.2% |
Demographics Similar to Albanians by In Labor Force | Age 35-44
In terms of in labor force | age 35-44, the demographic groups most similar to Albanians are Serbian (85.1%, a difference of 0.0%), Chinese (85.1%, a difference of 0.010%), Slovak (85.1%, a difference of 0.010%), Immigrants from Latvia (85.0%, a difference of 0.020%), and Immigrants from Moldova (85.0%, a difference of 0.020%).
| Demographics | Rating | Rank | In Labor Force | Age 35-44 |
| Taiwanese | 99.6 /100 | #53 | Exceptional 85.1% |
| Turks | 99.5 /100 | #54 | Exceptional 85.1% |
| Soviet Union | 99.5 /100 | #55 | Exceptional 85.1% |
| Immigrants | Croatia | 99.5 /100 | #56 | Exceptional 85.1% |
| Chinese | 99.4 /100 | #57 | Exceptional 85.1% |
| Slovaks | 99.4 /100 | #58 | Exceptional 85.1% |
| Serbians | 99.4 /100 | #59 | Exceptional 85.1% |
| Albanians | 99.4 /100 | #60 | Exceptional 85.1% |
| Immigrants | Latvia | 99.3 /100 | #61 | Exceptional 85.0% |
| Immigrants | Moldova | 99.3 /100 | #62 | Exceptional 85.0% |
| Immigrants | Uganda | 99.3 /100 | #63 | Exceptional 85.0% |
| Swedes | 99.2 /100 | #64 | Exceptional 85.0% |
| Immigrants | Brazil | 99.2 /100 | #65 | Exceptional 85.0% |
| Immigrants | Haiti | 99.1 /100 | #66 | Exceptional 85.0% |
| Immigrants | Italy | 99.1 /100 | #67 | Exceptional 85.0% |