Alsatian vs Albanian In Labor Force | Age 35-44
COMPARE
Alsatian
Albanian
In Labor Force | Age 35-44
In Labor Force | Age 35-44 Comparison
Alsatians
Albanians
84.4%
IN LABOR FORCE | AGE 35-44
55.2/ 100
METRIC RATING
166th/ 347
METRIC RANK
85.1%
IN LABOR FORCE | AGE 35-44
99.4/ 100
METRIC RATING
60th/ 347
METRIC RANK
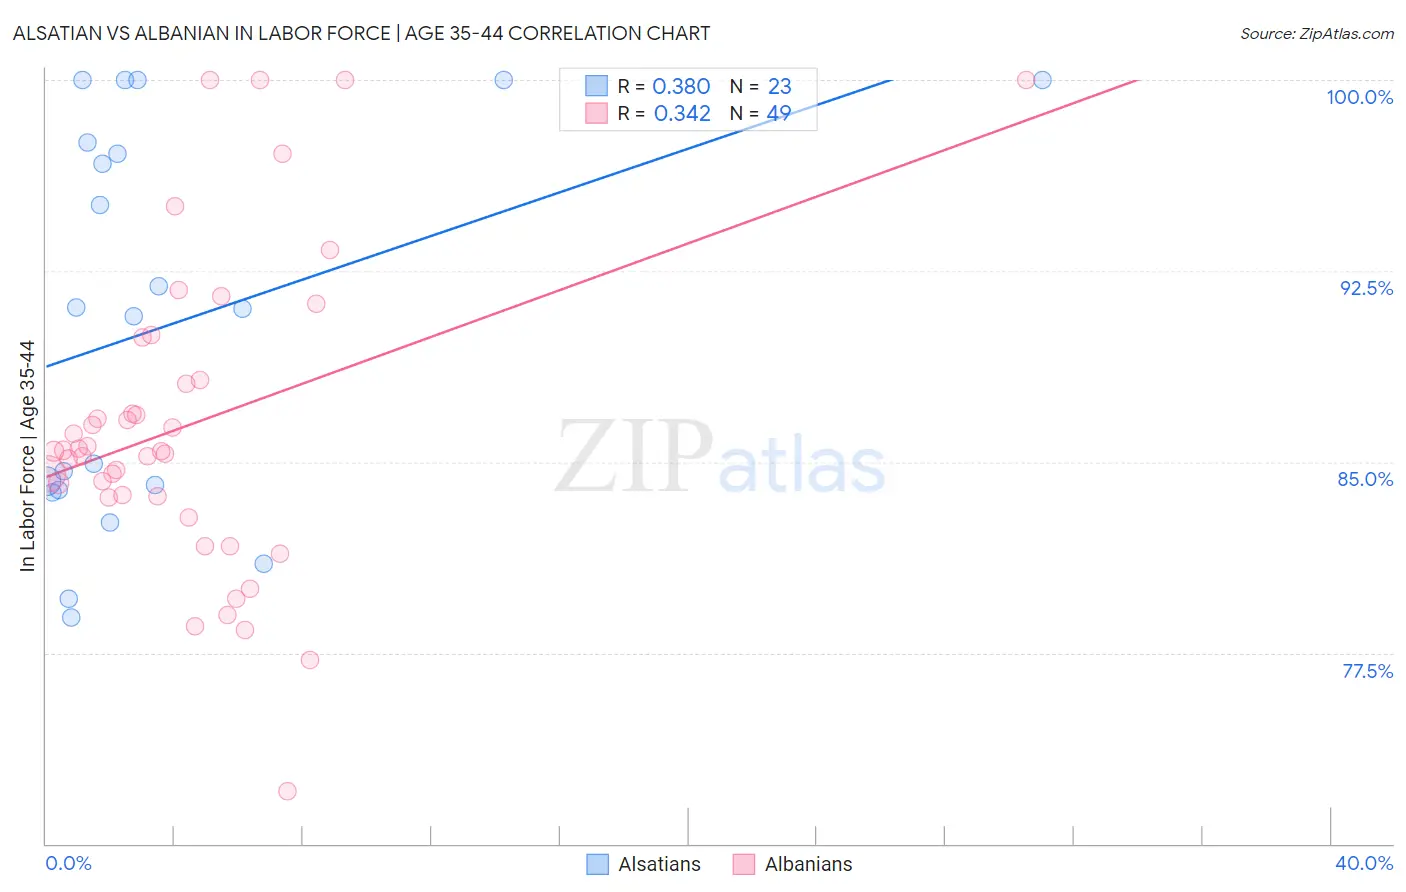
Alsatian vs Albanian In Labor Force | Age 35-44 Correlation Chart
The statistical analysis conducted on geographies consisting of 82,678,421 people shows a mild positive correlation between the proportion of Alsatians and labor force participation rate among population between the ages 35 and 44 in the United States with a correlation coefficient (R) of 0.380 and weighted average of 84.4%. Similarly, the statistical analysis conducted on geographies consisting of 193,210,440 people shows a mild positive correlation between the proportion of Albanians and labor force participation rate among population between the ages 35 and 44 in the United States with a correlation coefficient (R) of 0.342 and weighted average of 85.1%, a difference of 0.79%.
In Labor Force | Age 35-44 Correlation Summary
| Measurement | Alsatian | Albanian |
| Minimum | 78.9% | 72.1% |
| Maximum | 100.0% | 100.0% |
| Range | 21.1% | 27.9% |
| Mean | 90.4% | 86.4% |
| Median | 91.0% | 85.4% |
| Interquartile 25% (IQ1) | 83.9% | 83.6% |
| Interquartile 75% (IQ3) | 97.6% | 89.0% |
| Interquartile Range (IQR) | 13.7% | 5.4% |
| Standard Deviation (Sample) | 7.5% | 6.1% |
| Standard Deviation (Population) | 7.4% | 6.0% |
Similar Demographics by In Labor Force | Age 35-44
Demographics Similar to Alsatians by In Labor Force | Age 35-44
In terms of in labor force | age 35-44, the demographic groups most similar to Alsatians are Immigrants from Portugal (84.4%, a difference of 0.0%), Irish (84.4%, a difference of 0.010%), Nigerian (84.4%, a difference of 0.020%), Venezuelan (84.4%, a difference of 0.020%), and Immigrants from Afghanistan (84.4%, a difference of 0.020%).
| Demographics | Rating | Rank | In Labor Force | Age 35-44 |
| Immigrants | Senegal | 60.4 /100 | #159 | Good 84.4% |
| Immigrants | Kazakhstan | 60.4 /100 | #160 | Good 84.4% |
| Immigrants | Venezuela | 60.0 /100 | #161 | Good 84.4% |
| Immigrants | Hungary | 59.4 /100 | #162 | Average 84.4% |
| Aleuts | 59.1 /100 | #163 | Average 84.4% |
| Nigerians | 58.9 /100 | #164 | Average 84.4% |
| Venezuelans | 58.1 /100 | #165 | Average 84.4% |
| Alsatians | 55.2 /100 | #166 | Average 84.4% |
| Immigrants | Portugal | 55.2 /100 | #167 | Average 84.4% |
| Irish | 53.1 /100 | #168 | Average 84.4% |
| Immigrants | Afghanistan | 52.7 /100 | #169 | Average 84.4% |
| Immigrants | Jordan | 52.5 /100 | #170 | Average 84.4% |
| Jordanians | 51.7 /100 | #171 | Average 84.4% |
| Scandinavians | 51.2 /100 | #172 | Average 84.4% |
| Immigrants | Trinidad and Tobago | 50.7 /100 | #173 | Average 84.4% |
Demographics Similar to Albanians by In Labor Force | Age 35-44
In terms of in labor force | age 35-44, the demographic groups most similar to Albanians are Serbian (85.1%, a difference of 0.0%), Chinese (85.1%, a difference of 0.010%), Slovak (85.1%, a difference of 0.010%), Immigrants from Latvia (85.0%, a difference of 0.020%), and Immigrants from Moldova (85.0%, a difference of 0.020%).
| Demographics | Rating | Rank | In Labor Force | Age 35-44 |
| Taiwanese | 99.6 /100 | #53 | Exceptional 85.1% |
| Turks | 99.5 /100 | #54 | Exceptional 85.1% |
| Soviet Union | 99.5 /100 | #55 | Exceptional 85.1% |
| Immigrants | Croatia | 99.5 /100 | #56 | Exceptional 85.1% |
| Chinese | 99.4 /100 | #57 | Exceptional 85.1% |
| Slovaks | 99.4 /100 | #58 | Exceptional 85.1% |
| Serbians | 99.4 /100 | #59 | Exceptional 85.1% |
| Albanians | 99.4 /100 | #60 | Exceptional 85.1% |
| Immigrants | Latvia | 99.3 /100 | #61 | Exceptional 85.0% |
| Immigrants | Moldova | 99.3 /100 | #62 | Exceptional 85.0% |
| Immigrants | Uganda | 99.3 /100 | #63 | Exceptional 85.0% |
| Swedes | 99.2 /100 | #64 | Exceptional 85.0% |
| Immigrants | Brazil | 99.2 /100 | #65 | Exceptional 85.0% |
| Immigrants | Haiti | 99.1 /100 | #66 | Exceptional 85.0% |
| Immigrants | Italy | 99.1 /100 | #67 | Exceptional 85.0% |