Tohono O'odham vs West Indian 5th Grade
COMPARE
Tohono O'odham
West Indian
5th Grade
5th Grade Comparison
Tohono O'odham
West Indians
97.0%
5TH GRADE
3.2/ 100
METRIC RATING
234th/ 347
METRIC RANK
96.8%
5TH GRADE
0.3/ 100
METRIC RATING
264th/ 347
METRIC RANK
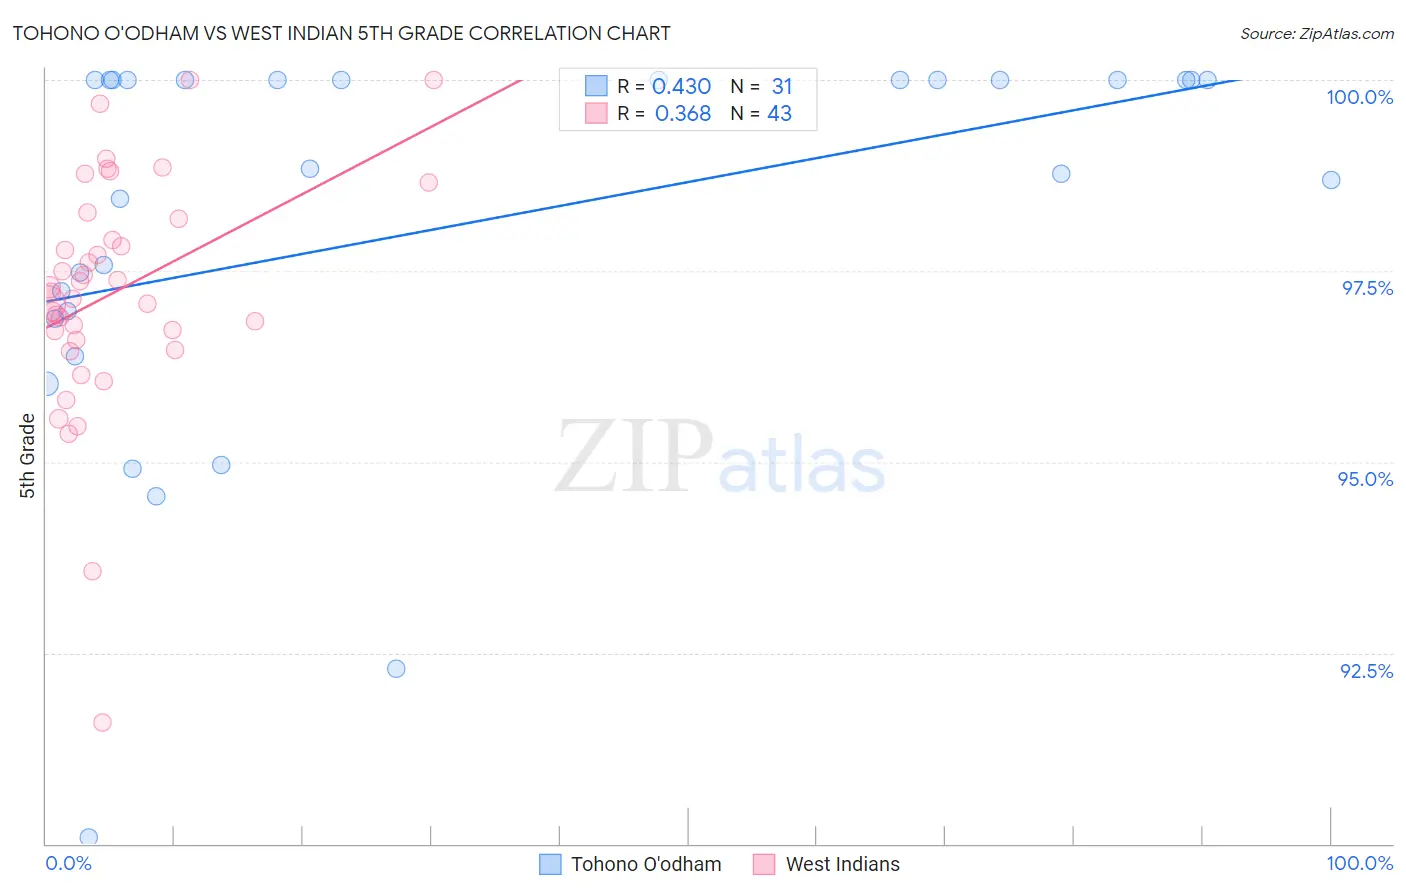
Tohono O'odham vs West Indian 5th Grade Correlation Chart
The statistical analysis conducted on geographies consisting of 58,730,615 people shows a moderate positive correlation between the proportion of Tohono O'odham and percentage of population with at least 5th grade education in the United States with a correlation coefficient (R) of 0.430 and weighted average of 97.0%. Similarly, the statistical analysis conducted on geographies consisting of 254,059,006 people shows a mild positive correlation between the proportion of West Indians and percentage of population with at least 5th grade education in the United States with a correlation coefficient (R) of 0.368 and weighted average of 96.8%, a difference of 0.24%.
5th Grade Correlation Summary
| Measurement | Tohono O'odham | West Indian |
| Minimum | 90.1% | 91.6% |
| Maximum | 100.0% | 100.0% |
| Range | 9.9% | 8.4% |
| Mean | 98.1% | 97.2% |
| Median | 98.8% | 97.2% |
| Interquartile 25% (IQ1) | 96.9% | 96.6% |
| Interquartile 75% (IQ3) | 100.0% | 98.2% |
| Interquartile Range (IQR) | 3.1% | 1.6% |
| Standard Deviation (Sample) | 2.6% | 1.6% |
| Standard Deviation (Population) | 2.5% | 1.5% |
Similar Demographics by 5th Grade
Demographics Similar to Tohono O'odham by 5th Grade
In terms of 5th grade, the demographic groups most similar to Tohono O'odham are Subsaharan African (97.0%, a difference of 0.0%), Uruguayan (97.0%, a difference of 0.0%), Immigrants from Eastern Asia (97.0%, a difference of 0.020%), Senegalese (97.0%, a difference of 0.020%), and Immigrants from Western Asia (97.0%, a difference of 0.030%).
| Demographics | Rating | Rank | 5th Grade |
| Immigrants | Pakistan | 4.7 /100 | #227 | Tragic 97.0% |
| Assyrians/Chaldeans/Syriacs | 4.5 /100 | #228 | Tragic 97.0% |
| Yuman | 4.5 /100 | #229 | Tragic 97.0% |
| Immigrants | Western Asia | 4.3 /100 | #230 | Tragic 97.0% |
| Immigrants | Malaysia | 4.1 /100 | #231 | Tragic 97.0% |
| Immigrants | Eastern Asia | 4.0 /100 | #232 | Tragic 97.0% |
| Sub-Saharan Africans | 3.3 /100 | #233 | Tragic 97.0% |
| Tohono O'odham | 3.2 /100 | #234 | Tragic 97.0% |
| Uruguayans | 3.2 /100 | #235 | Tragic 97.0% |
| Senegalese | 2.8 /100 | #236 | Tragic 97.0% |
| Immigrants | Indonesia | 2.0 /100 | #237 | Tragic 96.9% |
| Asians | 2.0 /100 | #238 | Tragic 96.9% |
| Nigerians | 1.9 /100 | #239 | Tragic 96.9% |
| Indians (Asian) | 1.9 /100 | #240 | Tragic 96.9% |
| Immigrants | Asia | 1.7 /100 | #241 | Tragic 96.9% |
Demographics Similar to West Indians by 5th Grade
In terms of 5th grade, the demographic groups most similar to West Indians are Taiwanese (96.7%, a difference of 0.0%), Immigrants from Colombia (96.8%, a difference of 0.010%), Immigrants from Uzbekistan (96.8%, a difference of 0.010%), Immigrants from Nigeria (96.7%, a difference of 0.010%), and Immigrants from South America (96.7%, a difference of 0.010%).
| Demographics | Rating | Rank | 5th Grade |
| Peruvians | 0.6 /100 | #257 | Tragic 96.8% |
| Immigrants | Ethiopia | 0.5 /100 | #258 | Tragic 96.8% |
| Immigrants | China | 0.5 /100 | #259 | Tragic 96.8% |
| Immigrants | Jamaica | 0.4 /100 | #260 | Tragic 96.8% |
| Immigrants | Sierra Leone | 0.4 /100 | #261 | Tragic 96.8% |
| Immigrants | Colombia | 0.4 /100 | #262 | Tragic 96.8% |
| Immigrants | Uzbekistan | 0.3 /100 | #263 | Tragic 96.8% |
| West Indians | 0.3 /100 | #264 | Tragic 96.8% |
| Taiwanese | 0.3 /100 | #265 | Tragic 96.7% |
| Immigrants | Nigeria | 0.3 /100 | #266 | Tragic 96.7% |
| Immigrants | South America | 0.3 /100 | #267 | Tragic 96.7% |
| Armenians | 0.3 /100 | #268 | Tragic 96.7% |
| Ghanaians | 0.2 /100 | #269 | Tragic 96.7% |
| Afghans | 0.2 /100 | #270 | Tragic 96.7% |
| Immigrants | Hong Kong | 0.2 /100 | #271 | Tragic 96.7% |