Tohono O'odham vs Sudanese In Labor Force | Age 25-29
COMPARE
Tohono O'odham
Sudanese
In Labor Force | Age 25-29
In Labor Force | Age 25-29 Comparison
Tohono O'odham
Sudanese
77.5%
IN LABOR FORCE | AGE 25-29
0.0/ 100
METRIC RATING
341st/ 347
METRIC RANK
85.9%
IN LABOR FORCE | AGE 25-29
100.0/ 100
METRIC RATING
25th/ 347
METRIC RANK
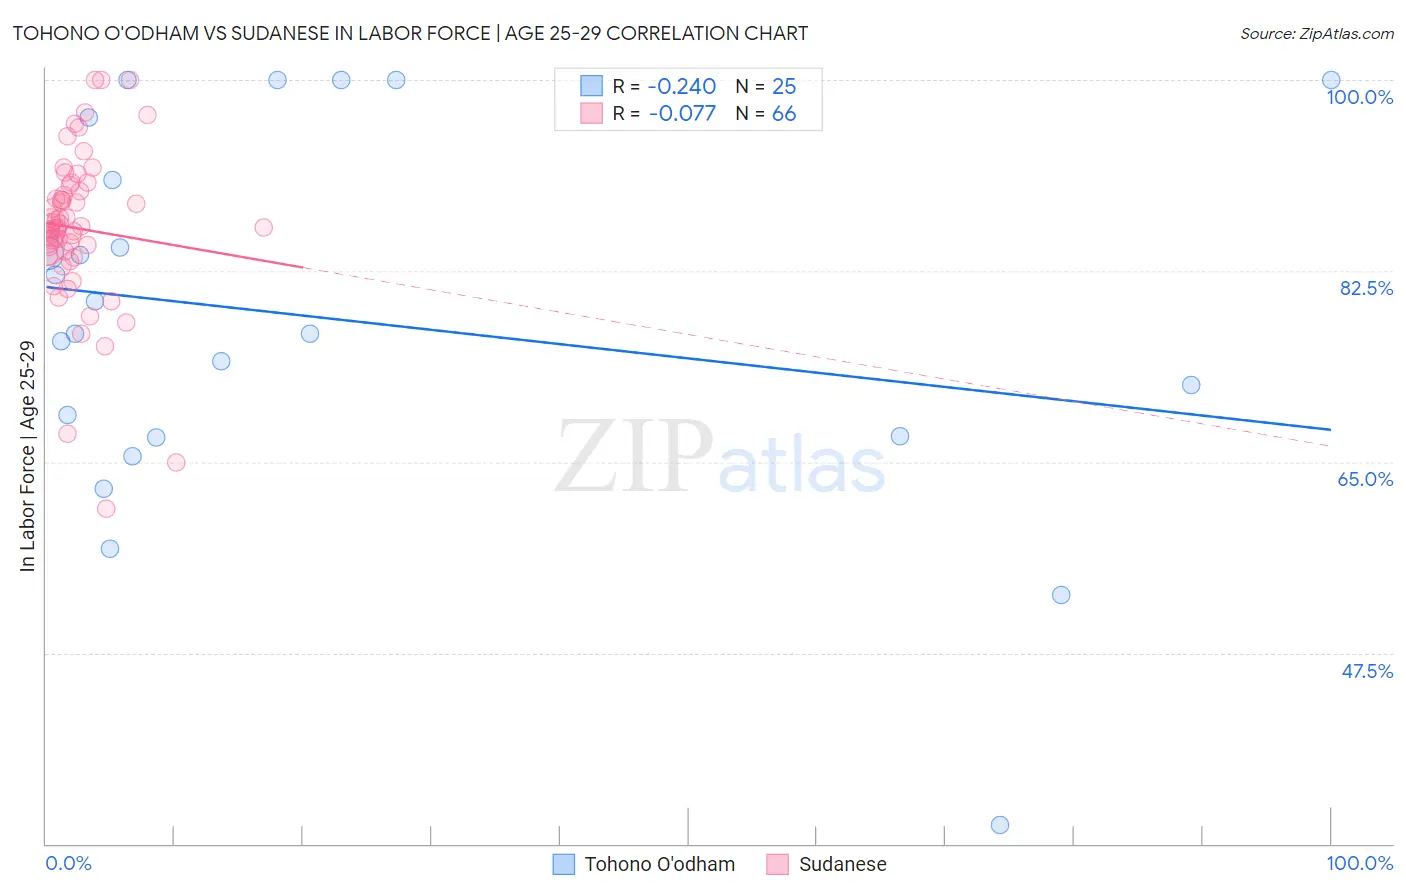
Tohono O'odham vs Sudanese In Labor Force | Age 25-29 Correlation Chart
The statistical analysis conducted on geographies consisting of 58,719,537 people shows a weak negative correlation between the proportion of Tohono O'odham and labor force participation rate among population between the ages 25 and 29 in the United States with a correlation coefficient (R) of -0.240 and weighted average of 77.5%. Similarly, the statistical analysis conducted on geographies consisting of 110,131,704 people shows a slight negative correlation between the proportion of Sudanese and labor force participation rate among population between the ages 25 and 29 in the United States with a correlation coefficient (R) of -0.077 and weighted average of 85.9%, a difference of 10.9%.
In Labor Force | Age 25-29 Correlation Summary
| Measurement | Tohono O'odham | Sudanese |
| Minimum | 31.7% | 60.7% |
| Maximum | 100.0% | 100.0% |
| Range | 68.3% | 39.3% |
| Mean | 78.0% | 86.4% |
| Median | 76.8% | 86.5% |
| Interquartile 25% (IQ1) | 67.3% | 84.3% |
| Interquartile 75% (IQ3) | 93.7% | 89.8% |
| Interquartile Range (IQR) | 26.4% | 5.5% |
| Standard Deviation (Sample) | 17.1% | 7.2% |
| Standard Deviation (Population) | 16.8% | 7.1% |
Similar Demographics by In Labor Force | Age 25-29
Demographics Similar to Tohono O'odham by In Labor Force | Age 25-29
In terms of in labor force | age 25-29, the demographic groups most similar to Tohono O'odham are Pueblo (77.5%, a difference of 0.010%), Paiute (78.1%, a difference of 0.78%), Immigrants from Yemen (78.2%, a difference of 0.94%), Lumbee (78.3%, a difference of 1.1%), and Arapaho (76.6%, a difference of 1.2%).
| Demographics | Rating | Rank | In Labor Force | Age 25-29 |
| Sioux | 0.0 /100 | #333 | Tragic 79.7% |
| Yuman | 0.0 /100 | #334 | Tragic 79.3% |
| Natives/Alaskans | 0.0 /100 | #335 | Tragic 79.3% |
| Apache | 0.0 /100 | #336 | Tragic 79.2% |
| Crow | 0.0 /100 | #337 | Tragic 78.6% |
| Lumbee | 0.0 /100 | #338 | Tragic 78.3% |
| Immigrants | Yemen | 0.0 /100 | #339 | Tragic 78.2% |
| Paiute | 0.0 /100 | #340 | Tragic 78.1% |
| Tohono O'odham | 0.0 /100 | #341 | Tragic 77.5% |
| Pueblo | 0.0 /100 | #342 | Tragic 77.5% |
| Arapaho | 0.0 /100 | #343 | Tragic 76.6% |
| Hopi | 0.0 /100 | #344 | Tragic 76.5% |
| Navajo | 0.0 /100 | #345 | Tragic 74.6% |
| Pima | 0.0 /100 | #346 | Tragic 74.3% |
| Yup'ik | 0.0 /100 | #347 | Tragic 73.1% |
Demographics Similar to Sudanese by In Labor Force | Age 25-29
In terms of in labor force | age 25-29, the demographic groups most similar to Sudanese are Immigrants from Eastern Africa (86.0%, a difference of 0.010%), Immigrants from Uganda (86.0%, a difference of 0.020%), Cambodian (86.0%, a difference of 0.040%), Maltese (86.0%, a difference of 0.050%), and Immigrants from Ireland (86.0%, a difference of 0.060%).
| Demographics | Rating | Rank | In Labor Force | Age 25-29 |
| Bulgarians | 100.0 /100 | #18 | Exceptional 86.0% |
| Cape Verdeans | 100.0 /100 | #19 | Exceptional 86.0% |
| Immigrants | Ireland | 100.0 /100 | #20 | Exceptional 86.0% |
| Maltese | 100.0 /100 | #21 | Exceptional 86.0% |
| Cambodians | 100.0 /100 | #22 | Exceptional 86.0% |
| Immigrants | Uganda | 100.0 /100 | #23 | Exceptional 86.0% |
| Immigrants | Eastern Africa | 100.0 /100 | #24 | Exceptional 86.0% |
| Sudanese | 100.0 /100 | #25 | Exceptional 85.9% |
| Immigrants | North Macedonia | 100.0 /100 | #26 | Exceptional 85.9% |
| Paraguayans | 100.0 /100 | #27 | Exceptional 85.9% |
| Ugandans | 100.0 /100 | #28 | Exceptional 85.9% |
| Immigrants | Liberia | 100.0 /100 | #29 | Exceptional 85.9% |
| Immigrants | Serbia | 100.0 /100 | #30 | Exceptional 85.9% |
| German Russians | 100.0 /100 | #31 | Exceptional 85.8% |
| Slovaks | 100.0 /100 | #32 | Exceptional 85.8% |