Dutch West Indian vs Sudanese In Labor Force | Age 25-29
COMPARE
Dutch West Indian
Sudanese
In Labor Force | Age 25-29
In Labor Force | Age 25-29 Comparison
Dutch West Indians
Sudanese
81.1%
IN LABOR FORCE | AGE 25-29
0.0/ 100
METRIC RATING
325th/ 347
METRIC RANK
85.9%
IN LABOR FORCE | AGE 25-29
100.0/ 100
METRIC RATING
25th/ 347
METRIC RANK
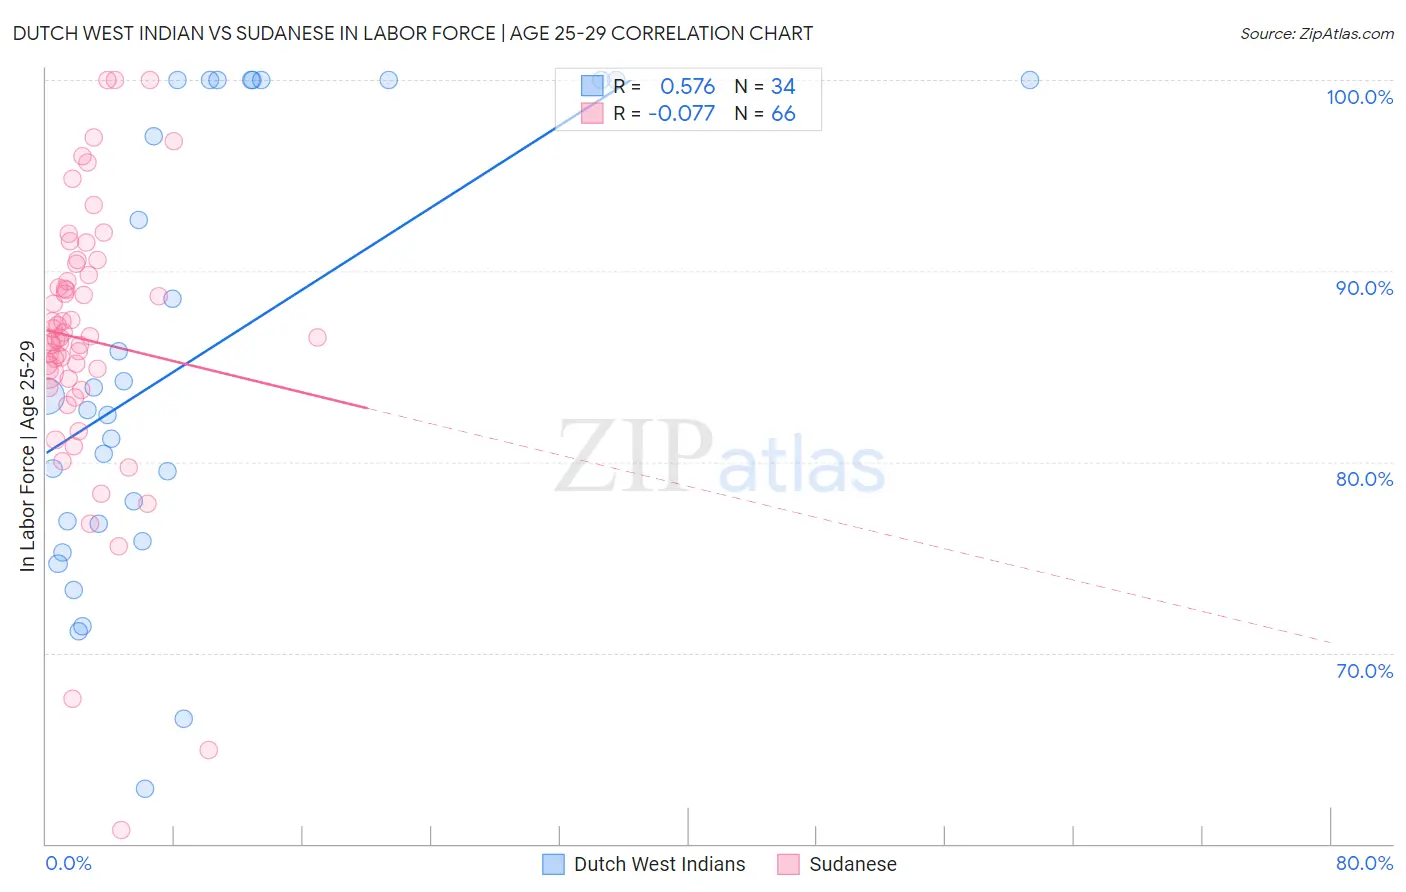
Dutch West Indian vs Sudanese In Labor Force | Age 25-29 Correlation Chart
The statistical analysis conducted on geographies consisting of 85,749,797 people shows a substantial positive correlation between the proportion of Dutch West Indians and labor force participation rate among population between the ages 25 and 29 in the United States with a correlation coefficient (R) of 0.576 and weighted average of 81.1%. Similarly, the statistical analysis conducted on geographies consisting of 110,131,704 people shows a slight negative correlation between the proportion of Sudanese and labor force participation rate among population between the ages 25 and 29 in the United States with a correlation coefficient (R) of -0.077 and weighted average of 85.9%, a difference of 5.9%.
In Labor Force | Age 25-29 Correlation Summary
| Measurement | Dutch West Indian | Sudanese |
| Minimum | 62.9% | 60.7% |
| Maximum | 100.0% | 100.0% |
| Range | 37.1% | 39.3% |
| Mean | 85.4% | 86.4% |
| Median | 83.1% | 86.5% |
| Interquartile 25% (IQ1) | 76.8% | 84.3% |
| Interquartile 75% (IQ3) | 100.0% | 89.8% |
| Interquartile Range (IQR) | 23.2% | 5.5% |
| Standard Deviation (Sample) | 11.5% | 7.2% |
| Standard Deviation (Population) | 11.4% | 7.1% |
Similar Demographics by In Labor Force | Age 25-29
Demographics Similar to Dutch West Indians by In Labor Force | Age 25-29
In terms of in labor force | age 25-29, the demographic groups most similar to Dutch West Indians are Houma (81.2%, a difference of 0.11%), Choctaw (81.0%, a difference of 0.20%), Ute (80.8%, a difference of 0.41%), Alaska Native (81.6%, a difference of 0.52%), and Creek (80.7%, a difference of 0.55%).
| Demographics | Rating | Rank | In Labor Force | Age 25-29 |
| Comanche | 0.0 /100 | #318 | Tragic 81.9% |
| Seminole | 0.0 /100 | #319 | Tragic 81.7% |
| Colville | 0.0 /100 | #320 | Tragic 81.6% |
| Shoshone | 0.0 /100 | #321 | Tragic 81.6% |
| Kiowa | 0.0 /100 | #322 | Tragic 81.6% |
| Alaska Natives | 0.0 /100 | #323 | Tragic 81.6% |
| Houma | 0.0 /100 | #324 | Tragic 81.2% |
| Dutch West Indians | 0.0 /100 | #325 | Tragic 81.1% |
| Choctaw | 0.0 /100 | #326 | Tragic 81.0% |
| Ute | 0.0 /100 | #327 | Tragic 80.8% |
| Creek | 0.0 /100 | #328 | Tragic 80.7% |
| Yakama | 0.0 /100 | #329 | Tragic 80.6% |
| Puerto Ricans | 0.0 /100 | #330 | Tragic 80.4% |
| Cheyenne | 0.0 /100 | #331 | Tragic 80.3% |
| Inupiat | 0.0 /100 | #332 | Tragic 79.8% |
Demographics Similar to Sudanese by In Labor Force | Age 25-29
In terms of in labor force | age 25-29, the demographic groups most similar to Sudanese are Immigrants from Eastern Africa (86.0%, a difference of 0.010%), Immigrants from Uganda (86.0%, a difference of 0.020%), Cambodian (86.0%, a difference of 0.040%), Maltese (86.0%, a difference of 0.050%), and Immigrants from Ireland (86.0%, a difference of 0.060%).
| Demographics | Rating | Rank | In Labor Force | Age 25-29 |
| Bulgarians | 100.0 /100 | #18 | Exceptional 86.0% |
| Cape Verdeans | 100.0 /100 | #19 | Exceptional 86.0% |
| Immigrants | Ireland | 100.0 /100 | #20 | Exceptional 86.0% |
| Maltese | 100.0 /100 | #21 | Exceptional 86.0% |
| Cambodians | 100.0 /100 | #22 | Exceptional 86.0% |
| Immigrants | Uganda | 100.0 /100 | #23 | Exceptional 86.0% |
| Immigrants | Eastern Africa | 100.0 /100 | #24 | Exceptional 86.0% |
| Sudanese | 100.0 /100 | #25 | Exceptional 85.9% |
| Immigrants | North Macedonia | 100.0 /100 | #26 | Exceptional 85.9% |
| Paraguayans | 100.0 /100 | #27 | Exceptional 85.9% |
| Ugandans | 100.0 /100 | #28 | Exceptional 85.9% |
| Immigrants | Liberia | 100.0 /100 | #29 | Exceptional 85.9% |
| Immigrants | Serbia | 100.0 /100 | #30 | Exceptional 85.9% |
| German Russians | 100.0 /100 | #31 | Exceptional 85.8% |
| Slovaks | 100.0 /100 | #32 | Exceptional 85.8% |