Assyrian/Chaldean/Syriac vs Sudanese In Labor Force | Age 25-29
COMPARE
Assyrian/Chaldean/Syriac
Sudanese
In Labor Force | Age 25-29
In Labor Force | Age 25-29 Comparison
Assyrians/Chaldeans/Syriacs
Sudanese
84.7%
IN LABOR FORCE | AGE 25-29
50.2/ 100
METRIC RATING
173rd/ 347
METRIC RANK
85.9%
IN LABOR FORCE | AGE 25-29
100.0/ 100
METRIC RATING
25th/ 347
METRIC RANK
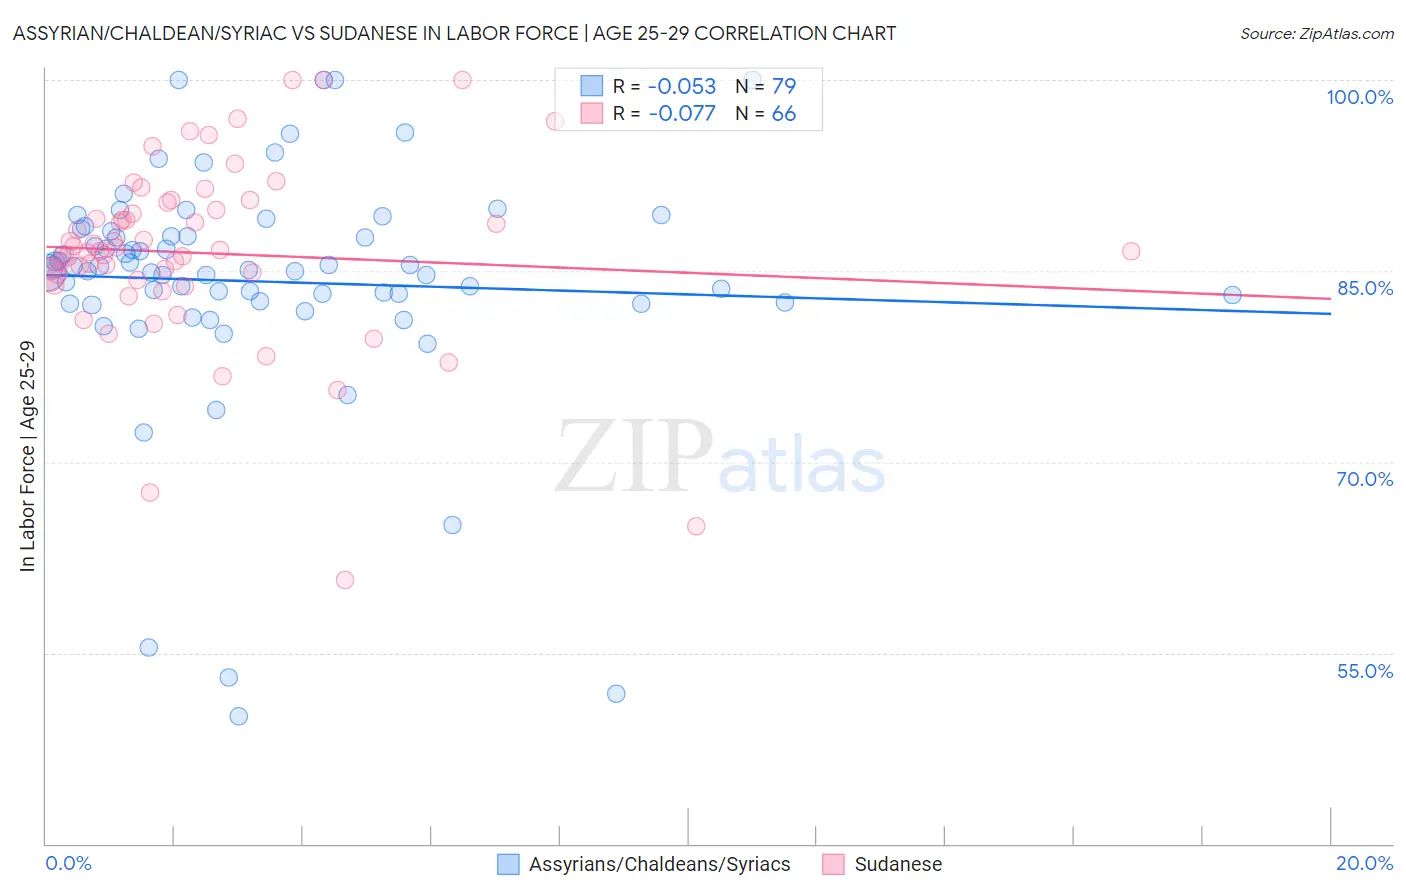
Assyrian/Chaldean/Syriac vs Sudanese In Labor Force | Age 25-29 Correlation Chart
The statistical analysis conducted on geographies consisting of 110,302,663 people shows a slight negative correlation between the proportion of Assyrians/Chaldeans/Syriacs and labor force participation rate among population between the ages 25 and 29 in the United States with a correlation coefficient (R) of -0.053 and weighted average of 84.7%. Similarly, the statistical analysis conducted on geographies consisting of 110,131,704 people shows a slight negative correlation between the proportion of Sudanese and labor force participation rate among population between the ages 25 and 29 in the United States with a correlation coefficient (R) of -0.077 and weighted average of 85.9%, a difference of 1.5%.
In Labor Force | Age 25-29 Correlation Summary
| Measurement | Assyrian/Chaldean/Syriac | Sudanese |
| Minimum | 50.0% | 60.7% |
| Maximum | 100.0% | 100.0% |
| Range | 50.0% | 39.3% |
| Mean | 84.2% | 86.4% |
| Median | 85.1% | 86.5% |
| Interquartile 25% (IQ1) | 82.5% | 84.3% |
| Interquartile 75% (IQ3) | 88.1% | 89.8% |
| Interquartile Range (IQR) | 5.6% | 5.5% |
| Standard Deviation (Sample) | 9.3% | 7.2% |
| Standard Deviation (Population) | 9.3% | 7.1% |
Similar Demographics by In Labor Force | Age 25-29
Demographics Similar to Assyrians/Chaldeans/Syriacs by In Labor Force | Age 25-29
In terms of in labor force | age 25-29, the demographic groups most similar to Assyrians/Chaldeans/Syriacs are Immigrants from Vietnam (84.7%, a difference of 0.0%), Immigrants from Western Europe (84.7%, a difference of 0.0%), Palestinian (84.7%, a difference of 0.0%), Celtic (84.7%, a difference of 0.020%), and Tongan (84.7%, a difference of 0.020%).
| Demographics | Rating | Rank | In Labor Force | Age 25-29 |
| Immigrants | Spain | 56.9 /100 | #166 | Average 84.7% |
| Indonesians | 56.5 /100 | #167 | Average 84.7% |
| South Americans | 54.9 /100 | #168 | Average 84.7% |
| Celtics | 52.5 /100 | #169 | Average 84.7% |
| Tongans | 52.4 /100 | #170 | Average 84.7% |
| Immigrants | Vietnam | 50.5 /100 | #171 | Average 84.7% |
| Immigrants | Western Europe | 50.4 /100 | #172 | Average 84.7% |
| Assyrians/Chaldeans/Syriacs | 50.2 /100 | #173 | Average 84.7% |
| Palestinians | 50.0 /100 | #174 | Average 84.7% |
| Hungarians | 47.8 /100 | #175 | Average 84.6% |
| Malaysians | 46.8 /100 | #176 | Average 84.6% |
| Immigrants | China | 45.7 /100 | #177 | Average 84.6% |
| Immigrants | Thailand | 45.2 /100 | #178 | Average 84.6% |
| Immigrants | Argentina | 44.0 /100 | #179 | Average 84.6% |
| Immigrants | South America | 42.9 /100 | #180 | Average 84.6% |
Demographics Similar to Sudanese by In Labor Force | Age 25-29
In terms of in labor force | age 25-29, the demographic groups most similar to Sudanese are Immigrants from Eastern Africa (86.0%, a difference of 0.010%), Immigrants from Uganda (86.0%, a difference of 0.020%), Cambodian (86.0%, a difference of 0.040%), Maltese (86.0%, a difference of 0.050%), and Immigrants from Ireland (86.0%, a difference of 0.060%).
| Demographics | Rating | Rank | In Labor Force | Age 25-29 |
| Bulgarians | 100.0 /100 | #18 | Exceptional 86.0% |
| Cape Verdeans | 100.0 /100 | #19 | Exceptional 86.0% |
| Immigrants | Ireland | 100.0 /100 | #20 | Exceptional 86.0% |
| Maltese | 100.0 /100 | #21 | Exceptional 86.0% |
| Cambodians | 100.0 /100 | #22 | Exceptional 86.0% |
| Immigrants | Uganda | 100.0 /100 | #23 | Exceptional 86.0% |
| Immigrants | Eastern Africa | 100.0 /100 | #24 | Exceptional 86.0% |
| Sudanese | 100.0 /100 | #25 | Exceptional 85.9% |
| Immigrants | North Macedonia | 100.0 /100 | #26 | Exceptional 85.9% |
| Paraguayans | 100.0 /100 | #27 | Exceptional 85.9% |
| Ugandans | 100.0 /100 | #28 | Exceptional 85.9% |
| Immigrants | Liberia | 100.0 /100 | #29 | Exceptional 85.9% |
| Immigrants | Serbia | 100.0 /100 | #30 | Exceptional 85.9% |
| German Russians | 100.0 /100 | #31 | Exceptional 85.8% |
| Slovaks | 100.0 /100 | #32 | Exceptional 85.8% |