Tohono O'odham vs Immigrants from Eritrea In Labor Force | Age > 16
COMPARE
Tohono O'odham
Immigrants from Eritrea
In Labor Force | Age > 16
In Labor Force | Age > 16 Comparison
Tohono O'odham
Immigrants from Eritrea
57.2%
IN LABOR FORCE | AGE > 16
0.0/ 100
METRIC RATING
345th/ 347
METRIC RANK
68.9%
IN LABOR FORCE | AGE > 16
100.0/ 100
METRIC RATING
6th/ 347
METRIC RANK
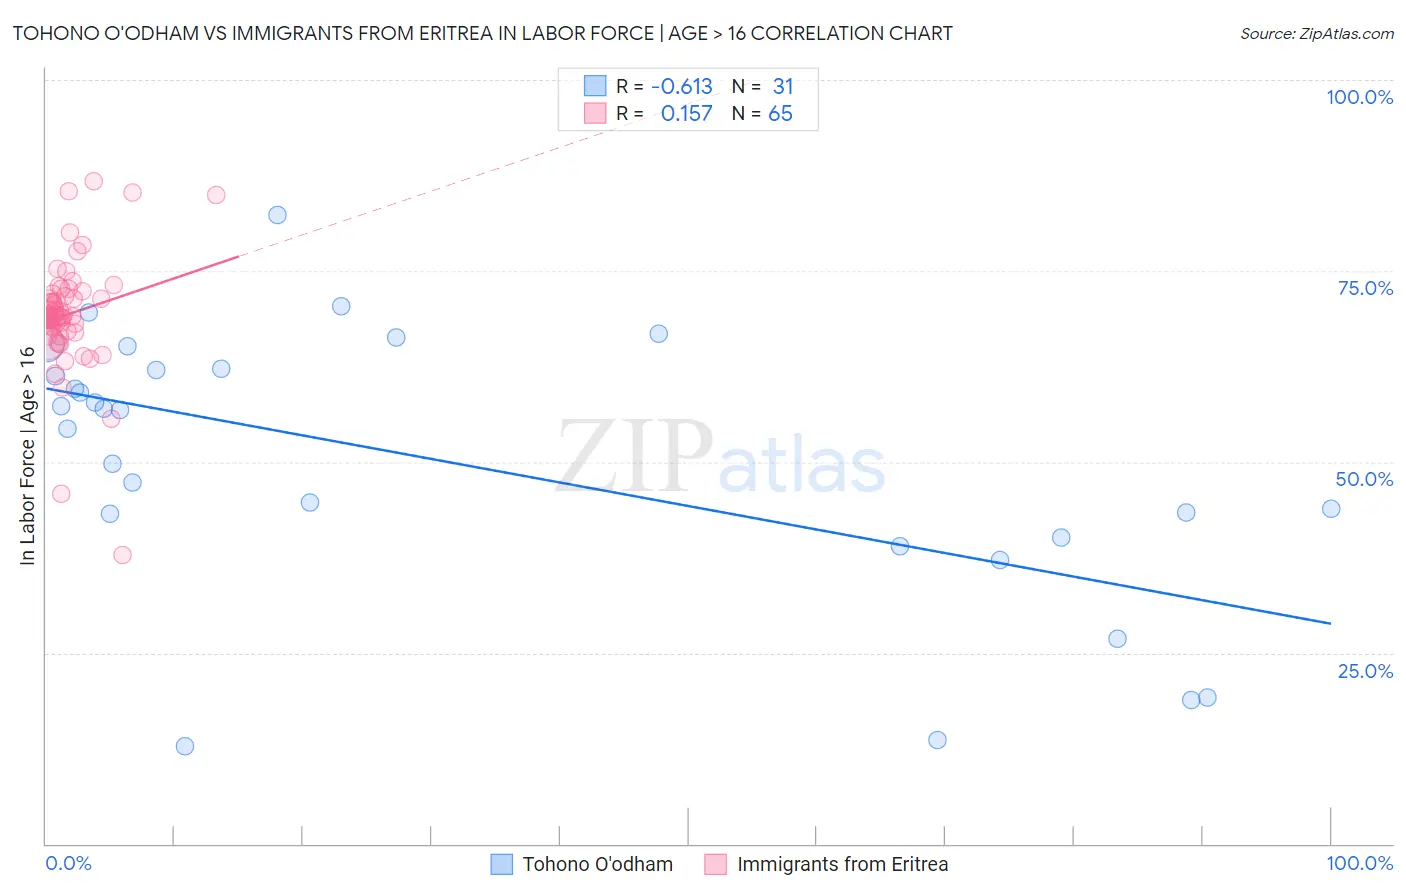
Tohono O'odham vs Immigrants from Eritrea In Labor Force | Age > 16 Correlation Chart
The statistical analysis conducted on geographies consisting of 58,725,311 people shows a significant negative correlation between the proportion of Tohono O'odham and labor force participation rate among population ages 16 and over in the United States with a correlation coefficient (R) of -0.613 and weighted average of 57.2%. Similarly, the statistical analysis conducted on geographies consisting of 104,852,450 people shows a poor positive correlation between the proportion of Immigrants from Eritrea and labor force participation rate among population ages 16 and over in the United States with a correlation coefficient (R) of 0.157 and weighted average of 68.9%, a difference of 20.3%.
In Labor Force | Age > 16 Correlation Summary
| Measurement | Tohono O'odham | Immigrants from Eritrea |
| Minimum | 12.8% | 37.8% |
| Maximum | 82.3% | 86.8% |
| Range | 69.5% | 49.0% |
| Mean | 50.1% | 69.3% |
| Median | 56.8% | 69.1% |
| Interquartile 25% (IQ1) | 40.1% | 67.0% |
| Interquartile 75% (IQ3) | 62.2% | 71.8% |
| Interquartile Range (IQR) | 22.1% | 4.9% |
| Standard Deviation (Sample) | 17.7% | 7.5% |
| Standard Deviation (Population) | 17.4% | 7.5% |
Similar Demographics by In Labor Force | Age > 16
Demographics Similar to Tohono O'odham by In Labor Force | Age > 16
In terms of in labor force | age > 16, the demographic groups most similar to Tohono O'odham are Pima (57.4%, a difference of 0.29%), Lumbee (56.8%, a difference of 0.85%), Yuman (57.8%, a difference of 0.99%), Navajo (56.6%, a difference of 1.2%), and Puerto Rican (58.1%, a difference of 1.5%).
| Demographics | Rating | Rank | In Labor Force | Age > 16 |
| Paiute | 0.0 /100 | #333 | Tragic 60.7% |
| Apache | 0.0 /100 | #334 | Tragic 60.7% |
| Natives/Alaskans | 0.0 /100 | #335 | Tragic 60.6% |
| Menominee | 0.0 /100 | #336 | Tragic 60.6% |
| Colville | 0.0 /100 | #337 | Tragic 59.8% |
| Immigrants | Yemen | 0.0 /100 | #338 | Tragic 59.6% |
| Houma | 0.0 /100 | #339 | Tragic 59.5% |
| Pueblo | 0.0 /100 | #340 | Tragic 59.3% |
| Hopi | 0.0 /100 | #341 | Tragic 58.4% |
| Puerto Ricans | 0.0 /100 | #342 | Tragic 58.1% |
| Yuman | 0.0 /100 | #343 | Tragic 57.8% |
| Pima | 0.0 /100 | #344 | Tragic 57.4% |
| Tohono O'odham | 0.0 /100 | #345 | Tragic 57.2% |
| Lumbee | 0.0 /100 | #346 | Tragic 56.8% |
| Navajo | 0.0 /100 | #347 | Tragic 56.6% |
Demographics Similar to Immigrants from Eritrea by In Labor Force | Age > 16
In terms of in labor force | age > 16, the demographic groups most similar to Immigrants from Eritrea are Sierra Leonean (68.9%, a difference of 0.050%), Immigrants from Cameroon (68.7%, a difference of 0.25%), Immigrants from Somalia (69.1%, a difference of 0.36%), Somali (69.2%, a difference of 0.43%), and Immigrants from Sierra Leone (68.5%, a difference of 0.57%).
| Demographics | Rating | Rank | In Labor Force | Age > 16 |
| Immigrants | Ethiopia | 100.0 /100 | #1 | Exceptional 69.4% |
| Ethiopians | 100.0 /100 | #2 | Exceptional 69.3% |
| Somalis | 100.0 /100 | #3 | Exceptional 69.2% |
| Immigrants | Somalia | 100.0 /100 | #4 | Exceptional 69.1% |
| Sierra Leoneans | 100.0 /100 | #5 | Exceptional 68.9% |
| Immigrants | Eritrea | 100.0 /100 | #6 | Exceptional 68.9% |
| Immigrants | Cameroon | 100.0 /100 | #7 | Exceptional 68.7% |
| Immigrants | Sierra Leone | 100.0 /100 | #8 | Exceptional 68.5% |
| Immigrants | Eastern Africa | 100.0 /100 | #9 | Exceptional 68.5% |
| Immigrants | Bolivia | 100.0 /100 | #10 | Exceptional 68.4% |
| Bolivians | 100.0 /100 | #11 | Exceptional 68.2% |
| Sudanese | 100.0 /100 | #12 | Exceptional 68.0% |
| Immigrants | Nepal | 100.0 /100 | #13 | Exceptional 68.0% |
| Liberians | 100.0 /100 | #14 | Exceptional 67.8% |
| Immigrants | Middle Africa | 100.0 /100 | #15 | Exceptional 67.7% |