Syrian vs Sioux In Labor Force | Age 30-34
COMPARE
Syrian
Sioux
In Labor Force | Age 30-34
In Labor Force | Age 30-34 Comparison
Syrians
Sioux
84.8%
IN LABOR FORCE | AGE 30-34
70.1/ 100
METRIC RATING
153rd/ 347
METRIC RANK
80.4%
IN LABOR FORCE | AGE 30-34
0.0/ 100
METRIC RATING
328th/ 347
METRIC RANK
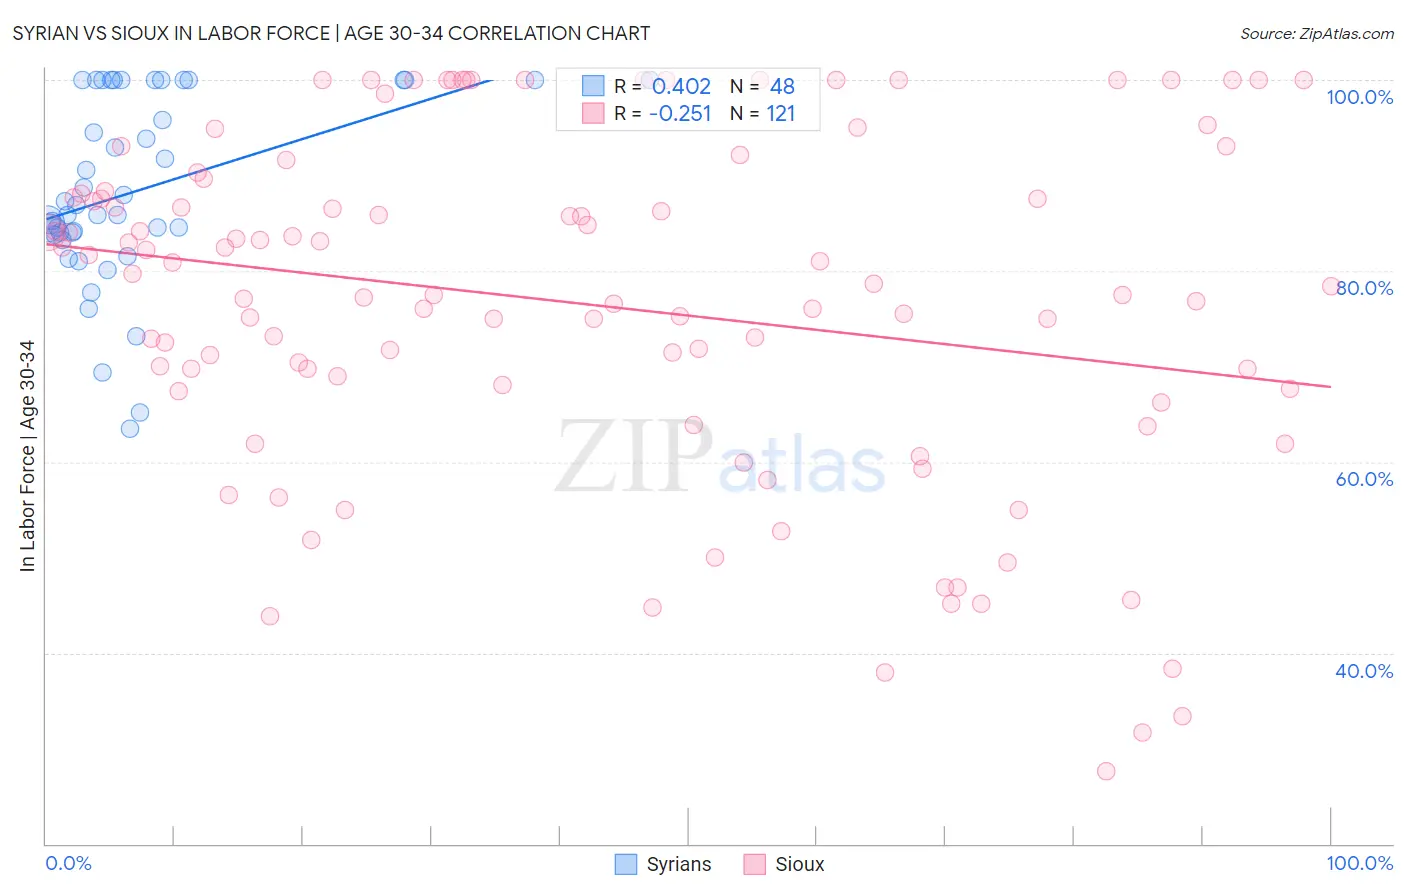
Syrian vs Sioux In Labor Force | Age 30-34 Correlation Chart
The statistical analysis conducted on geographies consisting of 266,193,214 people shows a moderate positive correlation between the proportion of Syrians and labor force participation rate among population between the ages 30 and 34 in the United States with a correlation coefficient (R) of 0.402 and weighted average of 84.8%. Similarly, the statistical analysis conducted on geographies consisting of 234,072,286 people shows a weak negative correlation between the proportion of Sioux and labor force participation rate among population between the ages 30 and 34 in the United States with a correlation coefficient (R) of -0.251 and weighted average of 80.4%, a difference of 5.5%.
In Labor Force | Age 30-34 Correlation Summary
| Measurement | Syrian | Sioux |
| Minimum | 63.5% | 27.6% |
| Maximum | 100.0% | 100.0% |
| Range | 36.5% | 72.4% |
| Mean | 88.4% | 76.6% |
| Median | 86.4% | 78.4% |
| Interquartile 25% (IQ1) | 83.9% | 67.6% |
| Interquartile 75% (IQ3) | 100.0% | 88.2% |
| Interquartile Range (IQR) | 16.1% | 20.6% |
| Standard Deviation (Sample) | 9.8% | 17.9% |
| Standard Deviation (Population) | 9.7% | 17.8% |
Similar Demographics by In Labor Force | Age 30-34
Demographics Similar to Syrians by In Labor Force | Age 30-34
In terms of in labor force | age 30-34, the demographic groups most similar to Syrians are Northern European (84.8%, a difference of 0.0%), Immigrants from Sudan (84.8%, a difference of 0.0%), French Canadian (84.8%, a difference of 0.020%), Immigrants from Senegal (84.8%, a difference of 0.030%), and Romanian (84.8%, a difference of 0.030%).
| Demographics | Rating | Rank | In Labor Force | Age 30-34 |
| Immigrants | Saudi Arabia | 76.6 /100 | #146 | Good 84.9% |
| Immigrants | Colombia | 76.3 /100 | #147 | Good 84.9% |
| Immigrants | Pakistan | 76.2 /100 | #148 | Good 84.9% |
| Immigrants | Ukraine | 75.1 /100 | #149 | Good 84.8% |
| Germans | 75.1 /100 | #150 | Good 84.8% |
| Immigrants | Senegal | 74.0 /100 | #151 | Good 84.8% |
| Romanians | 73.5 /100 | #152 | Good 84.8% |
| Syrians | 70.1 /100 | #153 | Good 84.8% |
| Northern Europeans | 70.0 /100 | #154 | Good 84.8% |
| Immigrants | Sudan | 69.5 /100 | #155 | Good 84.8% |
| French Canadians | 67.3 /100 | #156 | Good 84.8% |
| Peruvians | 65.9 /100 | #157 | Good 84.8% |
| Immigrants | Armenia | 64.7 /100 | #158 | Good 84.8% |
| Czechoslovakians | 63.0 /100 | #159 | Good 84.8% |
| Pakistanis | 60.8 /100 | #160 | Good 84.7% |
Demographics Similar to Sioux by In Labor Force | Age 30-34
In terms of in labor force | age 30-34, the demographic groups most similar to Sioux are Creek (80.4%, a difference of 0.010%), Colville (80.7%, a difference of 0.41%), Pueblo (80.0%, a difference of 0.41%), Houma (79.9%, a difference of 0.58%), and Seminole (80.8%, a difference of 0.60%).
| Demographics | Rating | Rank | In Labor Force | Age 30-34 |
| Alaska Natives | 0.0 /100 | #321 | Tragic 81.3% |
| Puerto Ricans | 0.0 /100 | #322 | Tragic 81.2% |
| Paiute | 0.0 /100 | #323 | Tragic 81.2% |
| Cheyenne | 0.0 /100 | #324 | Tragic 81.1% |
| Dutch West Indians | 0.0 /100 | #325 | Tragic 81.0% |
| Seminole | 0.0 /100 | #326 | Tragic 80.8% |
| Colville | 0.0 /100 | #327 | Tragic 80.7% |
| Sioux | 0.0 /100 | #328 | Tragic 80.4% |
| Creek | 0.0 /100 | #329 | Tragic 80.4% |
| Pueblo | 0.0 /100 | #330 | Tragic 80.0% |
| Houma | 0.0 /100 | #331 | Tragic 79.9% |
| Kiowa | 0.0 /100 | #332 | Tragic 79.8% |
| Inupiat | 0.0 /100 | #333 | Tragic 79.7% |
| Hopi | 0.0 /100 | #334 | Tragic 79.3% |
| Marshallese | 0.0 /100 | #335 | Tragic 79.2% |