Immigrants from Liberia vs Luxembourger In Labor Force | Age 30-34
COMPARE
Immigrants from Liberia
Luxembourger
In Labor Force | Age 30-34
In Labor Force | Age 30-34 Comparison
Immigrants from Liberia
Luxembourgers
85.9%
IN LABOR FORCE | AGE 30-34
100.0/ 100
METRIC RATING
27th/ 347
METRIC RANK
86.6%
IN LABOR FORCE | AGE 30-34
100.0/ 100
METRIC RATING
1st/ 347
METRIC RANK
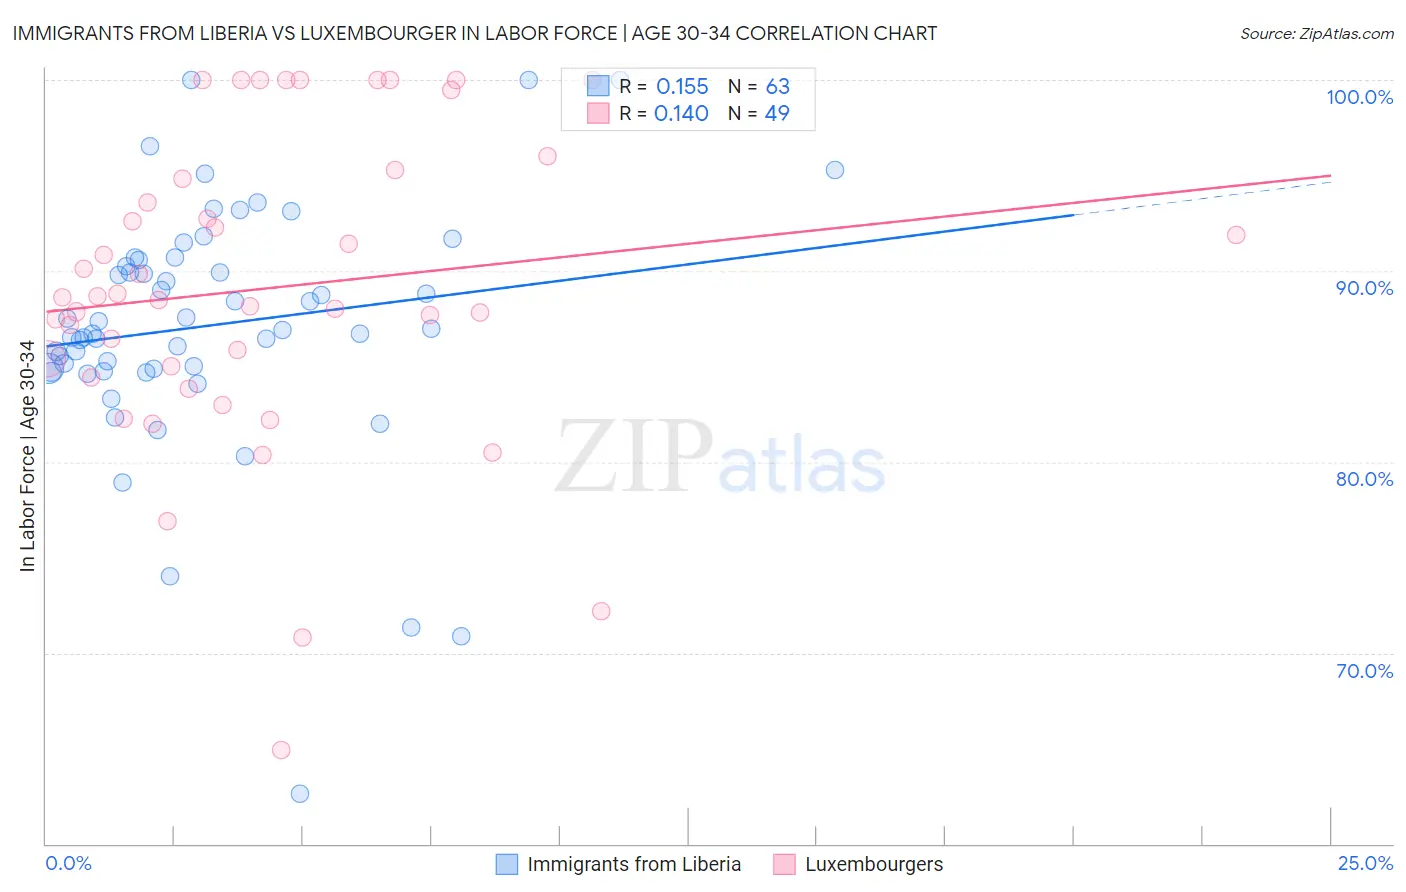
Immigrants from Liberia vs Luxembourger In Labor Force | Age 30-34 Correlation Chart
The statistical analysis conducted on geographies consisting of 135,261,200 people shows a poor positive correlation between the proportion of Immigrants from Liberia and labor force participation rate among population between the ages 30 and 34 in the United States with a correlation coefficient (R) of 0.155 and weighted average of 85.9%. Similarly, the statistical analysis conducted on geographies consisting of 144,656,260 people shows a poor positive correlation between the proportion of Luxembourgers and labor force participation rate among population between the ages 30 and 34 in the United States with a correlation coefficient (R) of 0.140 and weighted average of 86.6%, a difference of 0.84%.
In Labor Force | Age 30-34 Correlation Summary
| Measurement | Immigrants from Liberia | Luxembourger |
| Minimum | 62.6% | 64.9% |
| Maximum | 100.0% | 100.0% |
| Range | 37.4% | 35.1% |
| Mean | 87.1% | 89.1% |
| Median | 86.9% | 88.6% |
| Interquartile 25% (IQ1) | 84.9% | 84.7% |
| Interquartile 75% (IQ3) | 90.6% | 95.1% |
| Interquartile Range (IQR) | 5.7% | 10.4% |
| Standard Deviation (Sample) | 6.5% | 8.1% |
| Standard Deviation (Population) | 6.4% | 8.0% |
Similar Demographics by In Labor Force | Age 30-34
Demographics Similar to Immigrants from Liberia by In Labor Force | Age 30-34
In terms of in labor force | age 30-34, the demographic groups most similar to Immigrants from Liberia are Immigrants from Eastern Africa (85.9%, a difference of 0.020%), Immigrants from Eritrea (85.9%, a difference of 0.030%), Immigrants from North Macedonia (85.9%, a difference of 0.030%), Estonian (85.9%, a difference of 0.040%), and Immigrants from Latvia (85.9%, a difference of 0.040%).
| Demographics | Rating | Rank | In Labor Force | Age 30-34 |
| Bulgarians | 100.0 /100 | #20 | Exceptional 86.0% |
| Immigrants | Bulgaria | 100.0 /100 | #21 | Exceptional 86.0% |
| Bermudans | 100.0 /100 | #22 | Exceptional 85.9% |
| Estonians | 100.0 /100 | #23 | Exceptional 85.9% |
| Immigrants | Eritrea | 100.0 /100 | #24 | Exceptional 85.9% |
| Immigrants | North Macedonia | 100.0 /100 | #25 | Exceptional 85.9% |
| Immigrants | Eastern Africa | 100.0 /100 | #26 | Exceptional 85.9% |
| Immigrants | Liberia | 100.0 /100 | #27 | Exceptional 85.9% |
| Immigrants | Latvia | 100.0 /100 | #28 | Exceptional 85.9% |
| Tsimshian | 100.0 /100 | #29 | Exceptional 85.8% |
| Immigrants | Hong Kong | 100.0 /100 | #30 | Exceptional 85.8% |
| Paraguayans | 99.9 /100 | #31 | Exceptional 85.8% |
| Cypriots | 99.9 /100 | #32 | Exceptional 85.8% |
| Immigrants | Bosnia and Herzegovina | 99.9 /100 | #33 | Exceptional 85.8% |
| Ugandans | 99.9 /100 | #34 | Exceptional 85.8% |
Demographics Similar to Luxembourgers by In Labor Force | Age 30-34
In terms of in labor force | age 30-34, the demographic groups most similar to Luxembourgers are Ethiopian (86.6%, a difference of 0.070%), Immigrants from Ethiopia (86.6%, a difference of 0.080%), Liberian (86.4%, a difference of 0.28%), Immigrants from Ireland (86.3%, a difference of 0.42%), and Somali (86.2%, a difference of 0.45%).
| Demographics | Rating | Rank | In Labor Force | Age 30-34 |
| Luxembourgers | 100.0 /100 | #1 | Exceptional 86.6% |
| Ethiopians | 100.0 /100 | #2 | Exceptional 86.6% |
| Immigrants | Ethiopia | 100.0 /100 | #3 | Exceptional 86.6% |
| Liberians | 100.0 /100 | #4 | Exceptional 86.4% |
| Immigrants | Ireland | 100.0 /100 | #5 | Exceptional 86.3% |
| Somalis | 100.0 /100 | #6 | Exceptional 86.2% |
| Immigrants | Bolivia | 100.0 /100 | #7 | Exceptional 86.2% |
| Cambodians | 100.0 /100 | #8 | Exceptional 86.2% |
| Immigrants | Somalia | 100.0 /100 | #9 | Exceptional 86.2% |
| Immigrants | Serbia | 100.0 /100 | #10 | Exceptional 86.2% |
| Carpatho Rusyns | 100.0 /100 | #11 | Exceptional 86.2% |
| Bolivians | 100.0 /100 | #12 | Exceptional 86.1% |
| Immigrants | Croatia | 100.0 /100 | #13 | Exceptional 86.1% |
| Immigrants | Cabo Verde | 100.0 /100 | #14 | Exceptional 86.1% |
| Immigrants | Albania | 100.0 /100 | #15 | Exceptional 86.1% |