Yuman vs Luxembourger In Labor Force | Age 30-34
COMPARE
Yuman
Luxembourger
In Labor Force | Age 30-34
In Labor Force | Age 30-34 Comparison
Yuman
Luxembourgers
77.1%
IN LABOR FORCE | AGE 30-34
0.0/ 100
METRIC RATING
344th/ 347
METRIC RANK
86.6%
IN LABOR FORCE | AGE 30-34
100.0/ 100
METRIC RATING
1st/ 347
METRIC RANK
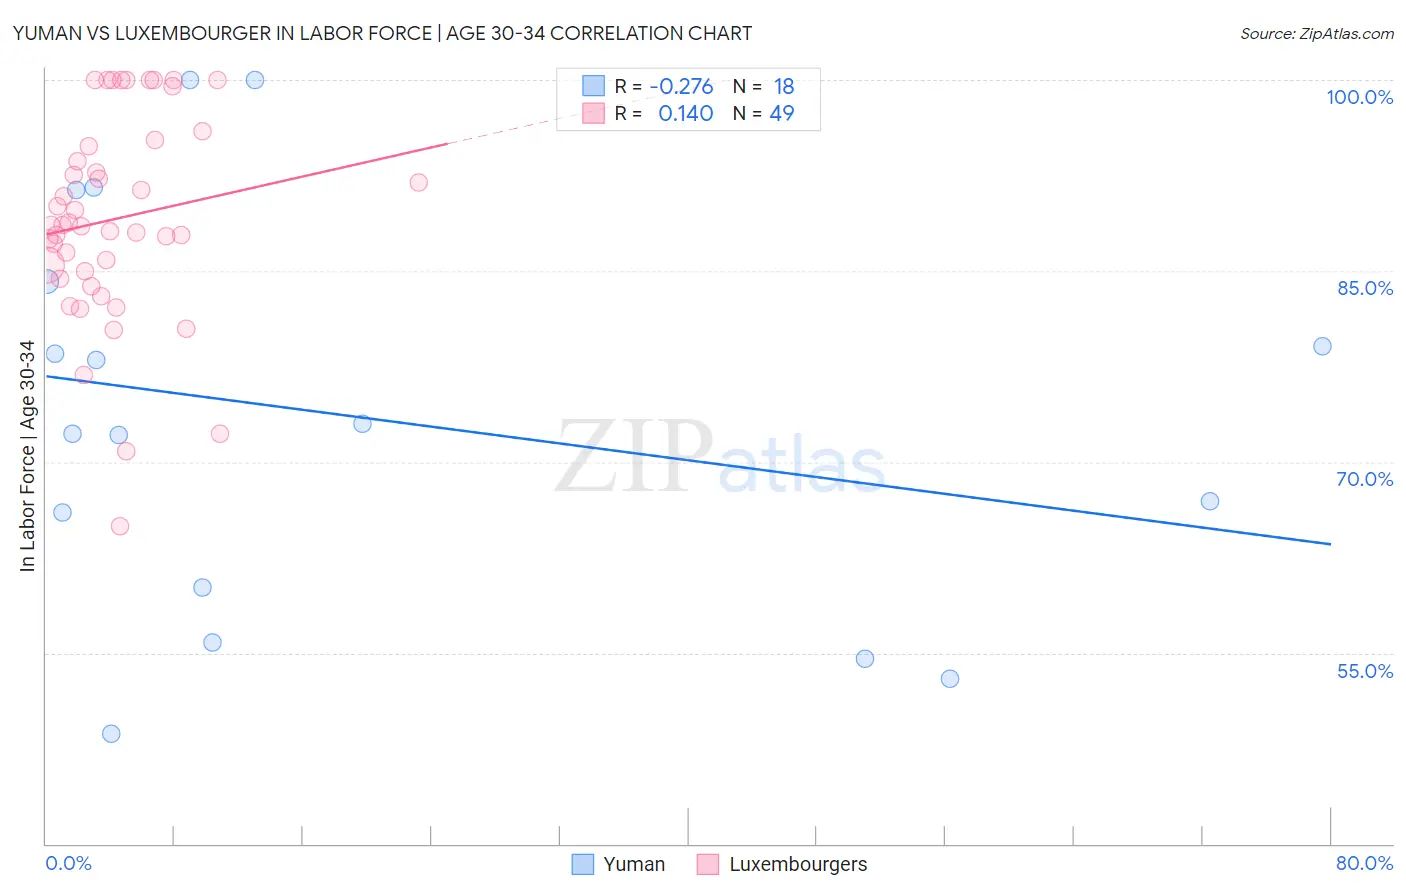
Yuman vs Luxembourger In Labor Force | Age 30-34 Correlation Chart
The statistical analysis conducted on geographies consisting of 40,678,210 people shows a weak negative correlation between the proportion of Yuman and labor force participation rate among population between the ages 30 and 34 in the United States with a correlation coefficient (R) of -0.276 and weighted average of 77.1%. Similarly, the statistical analysis conducted on geographies consisting of 144,656,260 people shows a poor positive correlation between the proportion of Luxembourgers and labor force participation rate among population between the ages 30 and 34 in the United States with a correlation coefficient (R) of 0.140 and weighted average of 86.6%, a difference of 12.4%.
In Labor Force | Age 30-34 Correlation Summary
| Measurement | Yuman | Luxembourger |
| Minimum | 48.6% | 64.9% |
| Maximum | 100.0% | 100.0% |
| Range | 51.4% | 35.1% |
| Mean | 73.6% | 89.1% |
| Median | 72.6% | 88.6% |
| Interquartile 25% (IQ1) | 60.1% | 84.7% |
| Interquartile 75% (IQ3) | 84.2% | 95.1% |
| Interquartile Range (IQR) | 24.1% | 10.4% |
| Standard Deviation (Sample) | 15.8% | 8.1% |
| Standard Deviation (Population) | 15.3% | 8.0% |
Similar Demographics by In Labor Force | Age 30-34
Demographics Similar to Yuman by In Labor Force | Age 30-34
In terms of in labor force | age 30-34, the demographic groups most similar to Yuman are Lumbee (77.3%, a difference of 0.23%), Tohono O'odham (77.7%, a difference of 0.84%), Yup'ik (76.4%, a difference of 0.87%), Immigrants from Yemen (78.2%, a difference of 1.4%), and Crow (75.9%, a difference of 1.5%).
| Demographics | Rating | Rank | In Labor Force | Age 30-34 |
| Inupiat | 0.0 /100 | #333 | Tragic 79.7% |
| Hopi | 0.0 /100 | #334 | Tragic 79.3% |
| Marshallese | 0.0 /100 | #335 | Tragic 79.2% |
| Natives/Alaskans | 0.0 /100 | #336 | Tragic 79.2% |
| Yakama | 0.0 /100 | #337 | Tragic 79.1% |
| Pima | 0.0 /100 | #338 | Tragic 79.0% |
| Apache | 0.0 /100 | #339 | Tragic 79.0% |
| Ute | 0.0 /100 | #340 | Tragic 78.9% |
| Immigrants | Yemen | 0.0 /100 | #341 | Tragic 78.2% |
| Tohono O'odham | 0.0 /100 | #342 | Tragic 77.7% |
| Lumbee | 0.0 /100 | #343 | Tragic 77.3% |
| Yuman | 0.0 /100 | #344 | Tragic 77.1% |
| Yup'ik | 0.0 /100 | #345 | Tragic 76.4% |
| Crow | 0.0 /100 | #346 | Tragic 75.9% |
| Navajo | 0.0 /100 | #347 | Tragic 73.8% |
Demographics Similar to Luxembourgers by In Labor Force | Age 30-34
In terms of in labor force | age 30-34, the demographic groups most similar to Luxembourgers are Ethiopian (86.6%, a difference of 0.070%), Immigrants from Ethiopia (86.6%, a difference of 0.080%), Liberian (86.4%, a difference of 0.28%), Immigrants from Ireland (86.3%, a difference of 0.42%), and Somali (86.2%, a difference of 0.45%).
| Demographics | Rating | Rank | In Labor Force | Age 30-34 |
| Luxembourgers | 100.0 /100 | #1 | Exceptional 86.6% |
| Ethiopians | 100.0 /100 | #2 | Exceptional 86.6% |
| Immigrants | Ethiopia | 100.0 /100 | #3 | Exceptional 86.6% |
| Liberians | 100.0 /100 | #4 | Exceptional 86.4% |
| Immigrants | Ireland | 100.0 /100 | #5 | Exceptional 86.3% |
| Somalis | 100.0 /100 | #6 | Exceptional 86.2% |
| Immigrants | Bolivia | 100.0 /100 | #7 | Exceptional 86.2% |
| Cambodians | 100.0 /100 | #8 | Exceptional 86.2% |
| Immigrants | Somalia | 100.0 /100 | #9 | Exceptional 86.2% |
| Immigrants | Serbia | 100.0 /100 | #10 | Exceptional 86.2% |
| Carpatho Rusyns | 100.0 /100 | #11 | Exceptional 86.2% |
| Bolivians | 100.0 /100 | #12 | Exceptional 86.1% |
| Immigrants | Croatia | 100.0 /100 | #13 | Exceptional 86.1% |
| Immigrants | Cabo Verde | 100.0 /100 | #14 | Exceptional 86.1% |
| Immigrants | Albania | 100.0 /100 | #15 | Exceptional 86.1% |