Immigrants from Netherlands vs Slovene In Labor Force | Age 35-44
COMPARE
Immigrants from Netherlands
Slovene
In Labor Force | Age 35-44
In Labor Force | Age 35-44 Comparison
Immigrants from Netherlands
Slovenes
84.5%
IN LABOR FORCE | AGE 35-44
76.6/ 100
METRIC RATING
147th/ 347
METRIC RANK
85.6%
IN LABOR FORCE | AGE 35-44
100.0/ 100
METRIC RATING
19th/ 347
METRIC RANK
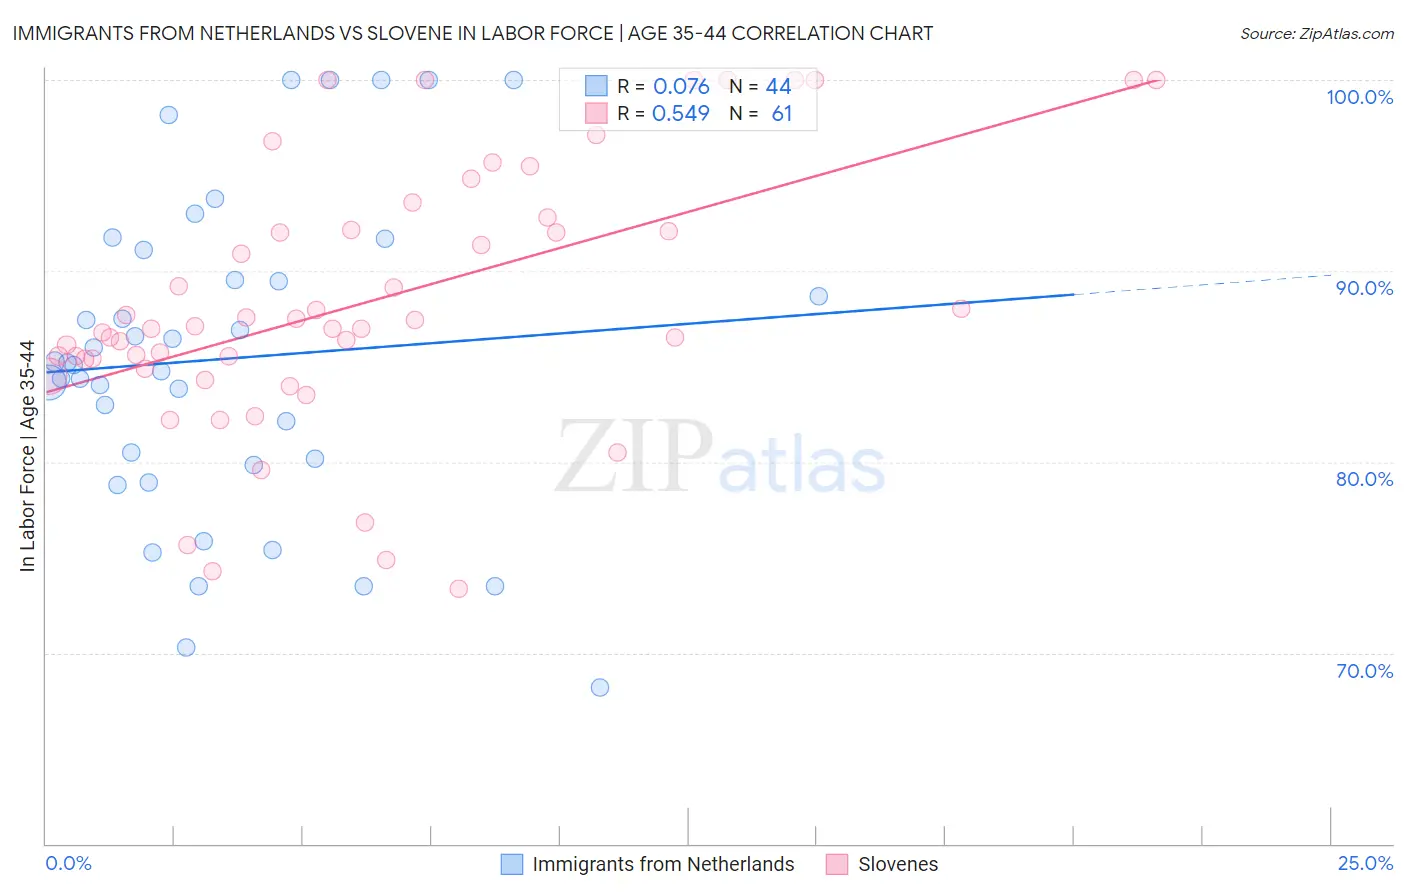
Immigrants from Netherlands vs Slovene In Labor Force | Age 35-44 Correlation Chart
The statistical analysis conducted on geographies consisting of 237,801,215 people shows a slight positive correlation between the proportion of Immigrants from Netherlands and labor force participation rate among population between the ages 35 and 44 in the United States with a correlation coefficient (R) of 0.076 and weighted average of 84.5%. Similarly, the statistical analysis conducted on geographies consisting of 261,289,238 people shows a substantial positive correlation between the proportion of Slovenes and labor force participation rate among population between the ages 35 and 44 in the United States with a correlation coefficient (R) of 0.549 and weighted average of 85.6%, a difference of 1.2%.
In Labor Force | Age 35-44 Correlation Summary
| Measurement | Immigrants from Netherlands | Slovene |
| Minimum | 68.2% | 73.4% |
| Maximum | 100.0% | 100.0% |
| Range | 31.8% | 26.6% |
| Mean | 85.4% | 88.4% |
| Median | 85.1% | 87.0% |
| Interquartile 25% (IQ1) | 80.0% | 85.1% |
| Interquartile 75% (IQ3) | 90.3% | 92.5% |
| Interquartile Range (IQR) | 10.3% | 7.3% |
| Standard Deviation (Sample) | 8.3% | 6.9% |
| Standard Deviation (Population) | 8.2% | 6.8% |
Similar Demographics by In Labor Force | Age 35-44
Demographics Similar to Immigrants from Netherlands by In Labor Force | Age 35-44
In terms of in labor force | age 35-44, the demographic groups most similar to Immigrants from Netherlands are Immigrants from Asia (84.5%, a difference of 0.020%), Immigrants from Uruguay (84.6%, a difference of 0.030%), Immigrants from Ukraine (84.6%, a difference of 0.030%), Immigrants from Jamaica (84.6%, a difference of 0.030%), and Immigrants from Saudi Arabia (84.6%, a difference of 0.030%).
| Demographics | Rating | Rank | In Labor Force | Age 35-44 |
| Immigrants | Japan | 81.4 /100 | #140 | Excellent 84.6% |
| Immigrants | Belgium | 80.8 /100 | #141 | Excellent 84.6% |
| Immigrants | Uruguay | 80.1 /100 | #142 | Excellent 84.6% |
| Immigrants | Ukraine | 79.7 /100 | #143 | Good 84.6% |
| Immigrants | Jamaica | 79.4 /100 | #144 | Good 84.6% |
| Immigrants | Saudi Arabia | 79.4 /100 | #145 | Good 84.6% |
| Immigrants | Asia | 78.7 /100 | #146 | Good 84.5% |
| Immigrants | Netherlands | 76.6 /100 | #147 | Good 84.5% |
| South American Indians | 73.6 /100 | #148 | Good 84.5% |
| Okinawans | 73.5 /100 | #149 | Good 84.5% |
| Immigrants | Nigeria | 73.3 /100 | #150 | Good 84.5% |
| Romanians | 72.1 /100 | #151 | Good 84.5% |
| Immigrants | Taiwan | 71.4 /100 | #152 | Good 84.5% |
| Trinidadians and Tobagonians | 69.5 /100 | #153 | Good 84.5% |
| Iranians | 69.4 /100 | #154 | Good 84.5% |
Demographics Similar to Slovenes by In Labor Force | Age 35-44
In terms of in labor force | age 35-44, the demographic groups most similar to Slovenes are Immigrants from North Macedonia (85.6%, a difference of 0.0%), Carpatho Rusyn (85.6%, a difference of 0.0%), Immigrants from Serbia (85.5%, a difference of 0.040%), Norwegian (85.6%, a difference of 0.050%), and Immigrants from Ireland (85.6%, a difference of 0.050%).
| Demographics | Rating | Rank | In Labor Force | Age 35-44 |
| Liberians | 100.0 /100 | #12 | Exceptional 85.7% |
| Somalis | 100.0 /100 | #13 | Exceptional 85.6% |
| Immigrants | Somalia | 100.0 /100 | #14 | Exceptional 85.6% |
| Norwegians | 100.0 /100 | #15 | Exceptional 85.6% |
| Immigrants | Ireland | 100.0 /100 | #16 | Exceptional 85.6% |
| Immigrants | North Macedonia | 100.0 /100 | #17 | Exceptional 85.6% |
| Carpatho Rusyns | 100.0 /100 | #18 | Exceptional 85.6% |
| Slovenes | 100.0 /100 | #19 | Exceptional 85.6% |
| Immigrants | Serbia | 100.0 /100 | #20 | Exceptional 85.5% |
| Bulgarians | 100.0 /100 | #21 | Exceptional 85.5% |
| Immigrants | Bosnia and Herzegovina | 100.0 /100 | #22 | Exceptional 85.4% |
| Immigrants | Eastern Africa | 100.0 /100 | #23 | Exceptional 85.4% |
| Latvians | 99.9 /100 | #24 | Exceptional 85.4% |
| Paraguayans | 99.9 /100 | #25 | Exceptional 85.4% |
| Immigrants | Liberia | 99.9 /100 | #26 | Exceptional 85.4% |