Thai vs Osage In Labor Force | Age 45-54
COMPARE
Thai
Osage
In Labor Force | Age 45-54
In Labor Force | Age 45-54 Comparison
Thais
Osage
84.3%
IN LABOR FORCE | AGE 45-54
100.0/ 100
METRIC RATING
11th/ 347
METRIC RANK
80.6%
IN LABOR FORCE | AGE 45-54
0.0/ 100
METRIC RATING
293rd/ 347
METRIC RANK
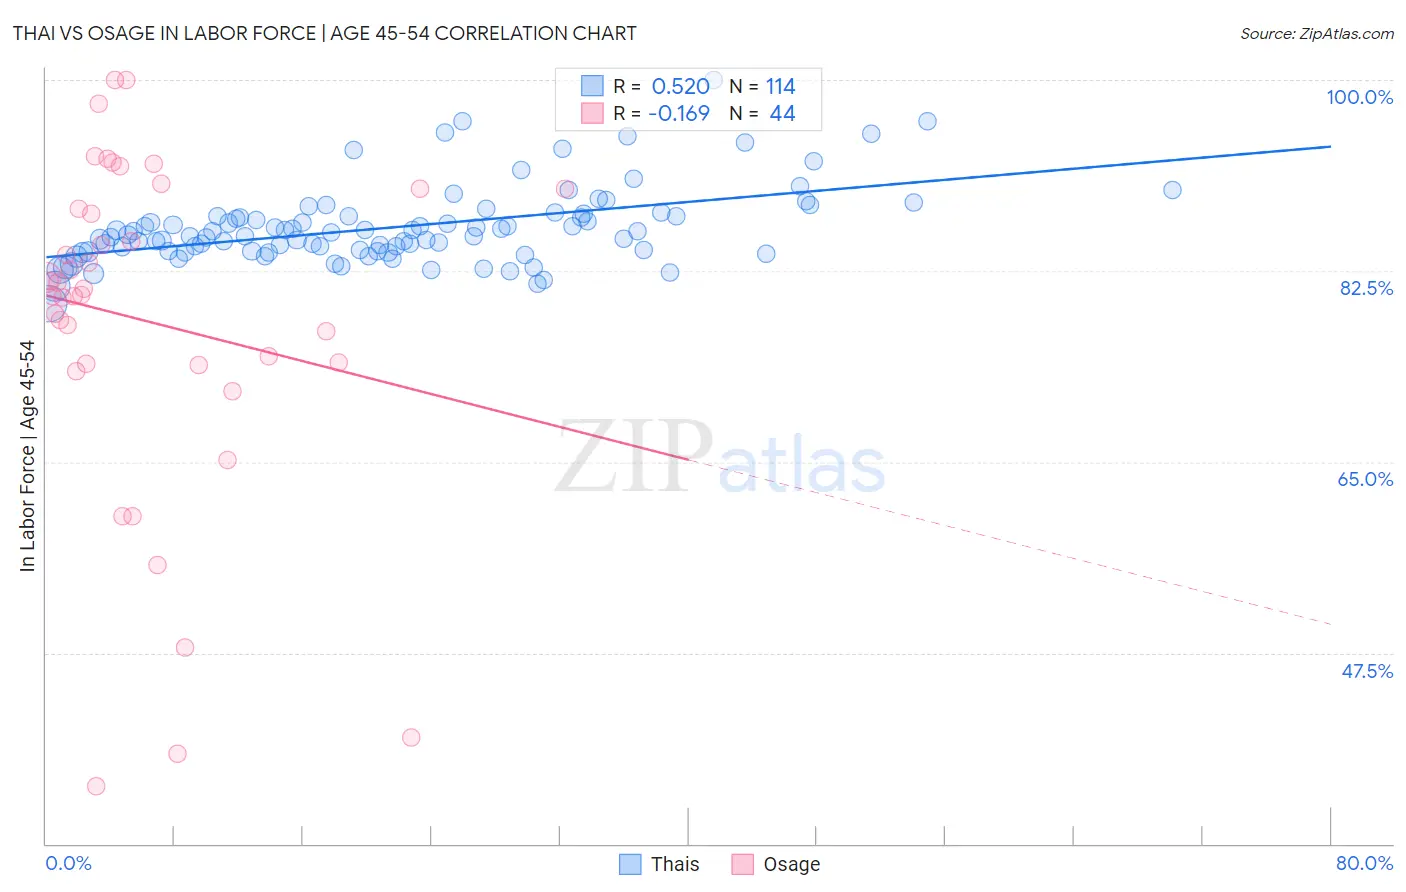
Thai vs Osage In Labor Force | Age 45-54 Correlation Chart
The statistical analysis conducted on geographies consisting of 475,327,867 people shows a substantial positive correlation between the proportion of Thais and labor force participation rate among population between the ages 45 and 54 in the United States with a correlation coefficient (R) of 0.520 and weighted average of 84.3%. Similarly, the statistical analysis conducted on geographies consisting of 91,796,641 people shows a poor negative correlation between the proportion of Osage and labor force participation rate among population between the ages 45 and 54 in the United States with a correlation coefficient (R) of -0.169 and weighted average of 80.6%, a difference of 4.6%.
In Labor Force | Age 45-54 Correlation Summary
| Measurement | Thai | Osage |
| Minimum | 79.5% | 35.3% |
| Maximum | 100.0% | 100.0% |
| Range | 20.5% | 64.7% |
| Mean | 86.5% | 77.9% |
| Median | 85.8% | 80.6% |
| Interquartile 25% (IQ1) | 84.3% | 74.0% |
| Interquartile 75% (IQ3) | 87.5% | 89.1% |
| Interquartile Range (IQR) | 3.2% | 15.1% |
| Standard Deviation (Sample) | 3.5% | 15.6% |
| Standard Deviation (Population) | 3.5% | 15.5% |
Similar Demographics by In Labor Force | Age 45-54
Demographics Similar to Thais by In Labor Force | Age 45-54
In terms of in labor force | age 45-54, the demographic groups most similar to Thais are Norwegian (84.4%, a difference of 0.090%), Immigrants from Sierra Leone (84.4%, a difference of 0.11%), Bulgarian (84.2%, a difference of 0.11%), Sierra Leonean (84.5%, a difference of 0.22%), and Chinese (84.1%, a difference of 0.22%).
| Demographics | Rating | Rank | In Labor Force | Age 45-54 |
| Immigrants | Ethiopia | 100.0 /100 | #4 | Exceptional 84.8% |
| Ethiopians | 100.0 /100 | #5 | Exceptional 84.8% |
| Immigrants | India | 100.0 /100 | #6 | Exceptional 84.7% |
| Immigrants | Cameroon | 100.0 /100 | #7 | Exceptional 84.6% |
| Sierra Leoneans | 100.0 /100 | #8 | Exceptional 84.5% |
| Immigrants | Sierra Leone | 100.0 /100 | #9 | Exceptional 84.4% |
| Norwegians | 100.0 /100 | #10 | Exceptional 84.4% |
| Thais | 100.0 /100 | #11 | Exceptional 84.3% |
| Bulgarians | 100.0 /100 | #12 | Exceptional 84.2% |
| Chinese | 99.9 /100 | #13 | Exceptional 84.1% |
| Cambodians | 99.9 /100 | #14 | Exceptional 84.1% |
| Cypriots | 99.9 /100 | #15 | Exceptional 84.1% |
| Immigrants | Nepal | 99.9 /100 | #16 | Exceptional 84.0% |
| Zimbabweans | 99.9 /100 | #17 | Exceptional 84.0% |
| Immigrants | South Central Asia | 99.9 /100 | #18 | Exceptional 84.0% |
Demographics Similar to Osage by In Labor Force | Age 45-54
In terms of in labor force | age 45-54, the demographic groups most similar to Osage are Yakama (80.6%, a difference of 0.0%), Iroquois (80.6%, a difference of 0.020%), Immigrants from Belize (80.6%, a difference of 0.050%), Nepalese (80.5%, a difference of 0.070%), and African (80.5%, a difference of 0.10%).
| Demographics | Rating | Rank | In Labor Force | Age 45-54 |
| Immigrants | Dominica | 0.0 /100 | #286 | Tragic 80.8% |
| Vietnamese | 0.0 /100 | #287 | Tragic 80.8% |
| Cree | 0.0 /100 | #288 | Tragic 80.8% |
| Immigrants | Bangladesh | 0.0 /100 | #289 | Tragic 80.7% |
| Mexican American Indians | 0.0 /100 | #290 | Tragic 80.7% |
| Immigrants | Belize | 0.0 /100 | #291 | Tragic 80.6% |
| Iroquois | 0.0 /100 | #292 | Tragic 80.6% |
| Osage | 0.0 /100 | #293 | Tragic 80.6% |
| Yakama | 0.0 /100 | #294 | Tragic 80.6% |
| Nepalese | 0.0 /100 | #295 | Tragic 80.5% |
| Africans | 0.0 /100 | #296 | Tragic 80.5% |
| Americans | 0.0 /100 | #297 | Tragic 80.4% |
| Marshallese | 0.0 /100 | #298 | Tragic 80.3% |
| Dominicans | 0.0 /100 | #299 | Tragic 80.3% |
| Fijians | 0.0 /100 | #300 | Tragic 80.2% |