Immigrants from Philippines vs Osage In Labor Force | Age 20-64
COMPARE
Immigrants from Philippines
Osage
In Labor Force | Age 20-64
In Labor Force | Age 20-64 Comparison
Immigrants from Philippines
Osage
79.8%
IN LABOR FORCE | AGE 20-64
78.0/ 100
METRIC RATING
147th/ 347
METRIC RANK
78.0%
IN LABOR FORCE | AGE 20-64
0.0/ 100
METRIC RATING
285th/ 347
METRIC RANK
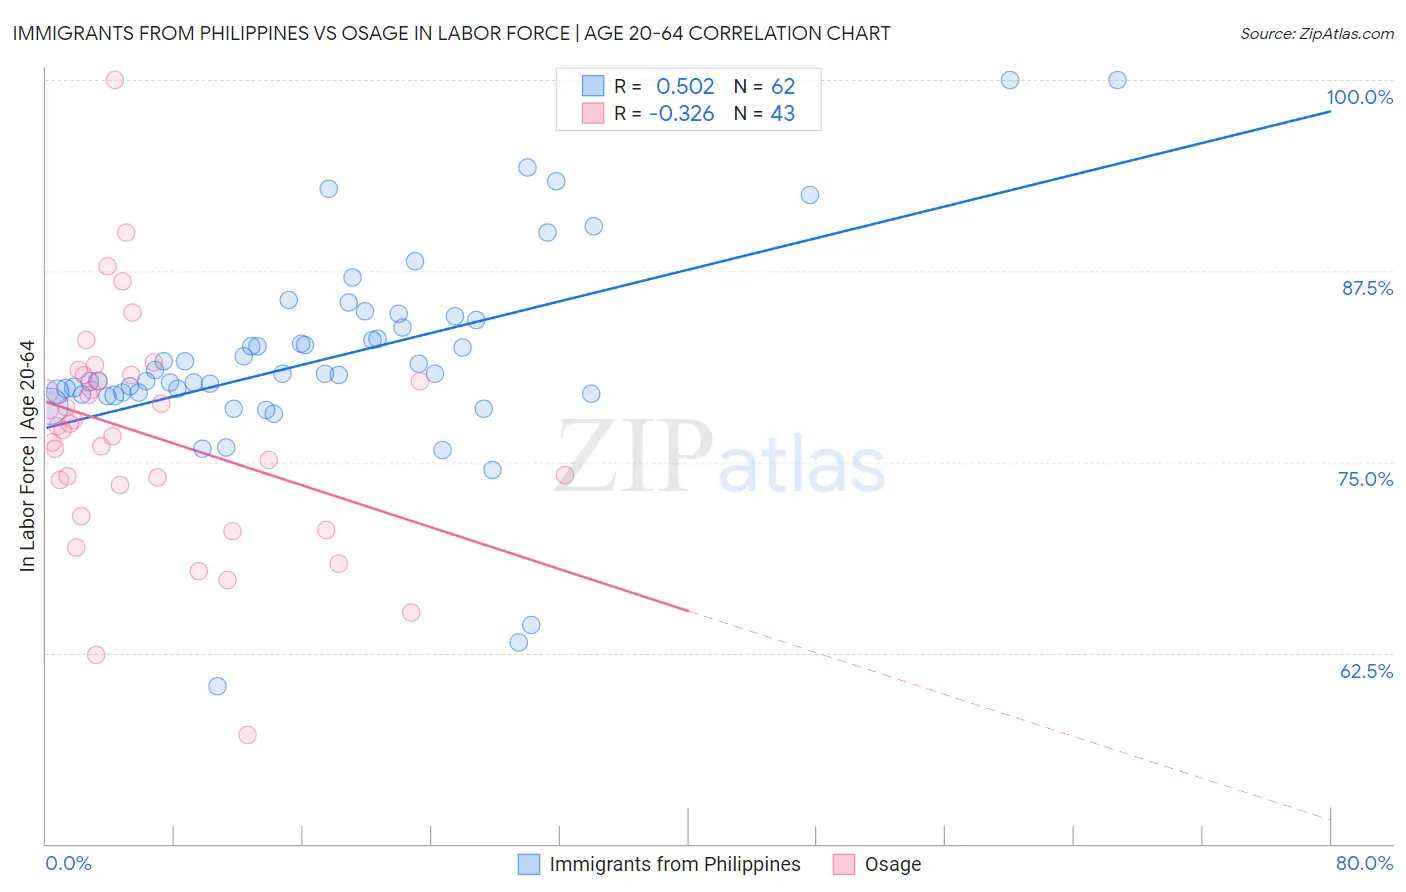
Immigrants from Philippines vs Osage In Labor Force | Age 20-64 Correlation Chart
The statistical analysis conducted on geographies consisting of 471,289,372 people shows a substantial positive correlation between the proportion of Immigrants from Philippines and labor force participation rate among population between the ages 20 and 64 in the United States with a correlation coefficient (R) of 0.502 and weighted average of 79.8%. Similarly, the statistical analysis conducted on geographies consisting of 91,799,408 people shows a mild negative correlation between the proportion of Osage and labor force participation rate among population between the ages 20 and 64 in the United States with a correlation coefficient (R) of -0.326 and weighted average of 78.0%, a difference of 2.3%.
In Labor Force | Age 20-64 Correlation Summary
| Measurement | Immigrants from Philippines | Osage |
| Minimum | 60.3% | 57.1% |
| Maximum | 100.0% | 100.0% |
| Range | 39.7% | 42.9% |
| Mean | 81.8% | 76.8% |
| Median | 80.8% | 77.4% |
| Interquartile 25% (IQ1) | 79.5% | 73.5% |
| Interquartile 75% (IQ3) | 84.3% | 80.7% |
| Interquartile Range (IQR) | 4.8% | 7.2% |
| Standard Deviation (Sample) | 6.9% | 7.5% |
| Standard Deviation (Population) | 6.8% | 7.4% |
Similar Demographics by In Labor Force | Age 20-64
Demographics Similar to Immigrants from Philippines by In Labor Force | Age 20-64
In terms of in labor force | age 20-64, the demographic groups most similar to Immigrants from Philippines are Romanian (79.8%, a difference of 0.0%), Immigrants from Southern Europe (79.8%, a difference of 0.010%), Immigrants from Israel (79.8%, a difference of 0.020%), Slovak (79.8%, a difference of 0.020%), and Immigrants from Sweden (79.8%, a difference of 0.020%).
| Demographics | Rating | Rank | In Labor Force | Age 20-64 |
| Immigrants | South Eastern Asia | 80.4 /100 | #140 | Excellent 79.8% |
| Immigrants | Israel | 80.0 /100 | #141 | Good 79.8% |
| Slovaks | 79.9 /100 | #142 | Good 79.8% |
| Immigrants | Sweden | 79.7 /100 | #143 | Good 79.8% |
| Koreans | 79.6 /100 | #144 | Good 79.8% |
| Pakistanis | 79.3 /100 | #145 | Good 79.8% |
| Immigrants | Southern Europe | 78.9 /100 | #146 | Good 79.8% |
| Immigrants | Philippines | 78.0 /100 | #147 | Good 79.8% |
| Romanians | 77.6 /100 | #148 | Good 79.8% |
| Icelanders | 75.1 /100 | #149 | Good 79.7% |
| Costa Ricans | 72.4 /100 | #150 | Good 79.7% |
| Scandinavians | 72.0 /100 | #151 | Good 79.7% |
| Immigrants | Northern Europe | 72.0 /100 | #152 | Good 79.7% |
| Immigrants | Kazakhstan | 69.5 /100 | #153 | Good 79.7% |
| New Zealanders | 69.4 /100 | #154 | Good 79.7% |
Demographics Similar to Osage by In Labor Force | Age 20-64
In terms of in labor force | age 20-64, the demographic groups most similar to Osage are Immigrants from Belize (78.0%, a difference of 0.010%), Vietnamese (78.0%, a difference of 0.010%), Hmong (77.9%, a difference of 0.090%), Immigrants from Guyana (78.1%, a difference of 0.10%), and African (77.9%, a difference of 0.10%).
| Demographics | Rating | Rank | In Labor Force | Age 20-64 |
| Mexican American Indians | 0.0 /100 | #278 | Tragic 78.2% |
| Belizeans | 0.0 /100 | #279 | Tragic 78.2% |
| Immigrants | Dominica | 0.0 /100 | #280 | Tragic 78.1% |
| Guyanese | 0.0 /100 | #281 | Tragic 78.1% |
| Immigrants | St. Vincent and the Grenadines | 0.0 /100 | #282 | Tragic 78.1% |
| Immigrants | Nonimmigrants | 0.0 /100 | #283 | Tragic 78.1% |
| Immigrants | Guyana | 0.0 /100 | #284 | Tragic 78.1% |
| Osage | 0.0 /100 | #285 | Tragic 78.0% |
| Immigrants | Belize | 0.0 /100 | #286 | Tragic 78.0% |
| Vietnamese | 0.0 /100 | #287 | Tragic 78.0% |
| Hmong | 0.0 /100 | #288 | Tragic 77.9% |
| Africans | 0.0 /100 | #289 | Tragic 77.9% |
| Immigrants | Bangladesh | 0.0 /100 | #290 | Tragic 77.9% |
| Spanish Americans | 0.0 /100 | #291 | Tragic 77.8% |
| Immigrants | Azores | 0.0 /100 | #292 | Tragic 77.8% |