Dutch vs Immigrants In Labor Force | Age 35-44
COMPARE
Dutch
Immigrants
In Labor Force | Age 35-44
In Labor Force | Age 35-44 Comparison
Dutch
Immigrants
84.3%
IN LABOR FORCE | AGE 35-44
34.8/ 100
METRIC RATING
187th/ 347
METRIC RANK
83.7%
IN LABOR FORCE | AGE 35-44
1.0/ 100
METRIC RATING
246th/ 347
METRIC RANK
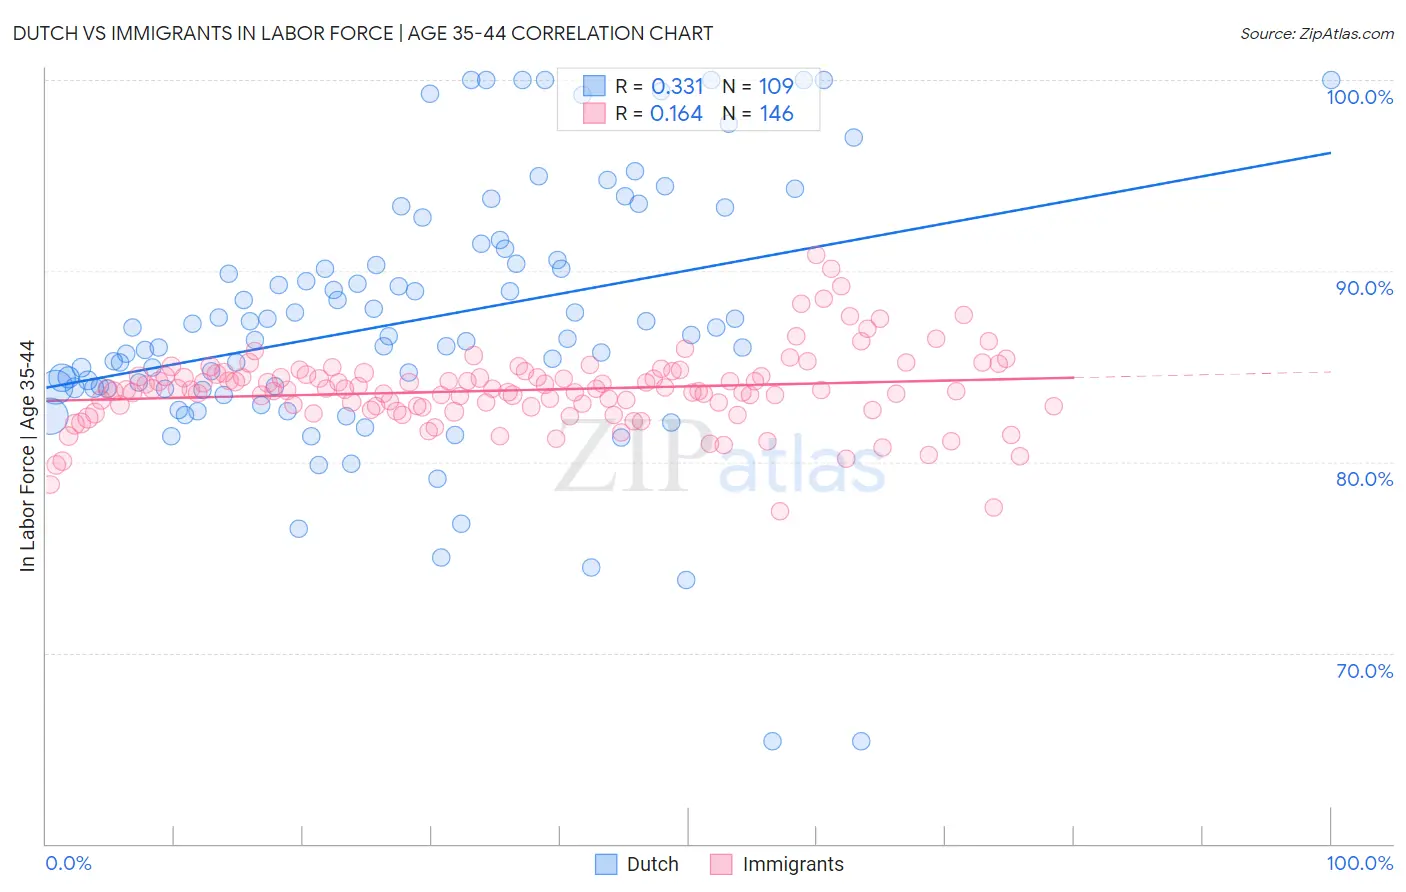
Dutch vs Immigrants In Labor Force | Age 35-44 Correlation Chart
The statistical analysis conducted on geographies consisting of 553,838,892 people shows a mild positive correlation between the proportion of Dutch and labor force participation rate among population between the ages 35 and 44 in the United States with a correlation coefficient (R) of 0.331 and weighted average of 84.3%. Similarly, the statistical analysis conducted on geographies consisting of 576,964,624 people shows a poor positive correlation between the proportion of Immigrants and labor force participation rate among population between the ages 35 and 44 in the United States with a correlation coefficient (R) of 0.164 and weighted average of 83.7%, a difference of 0.64%.
In Labor Force | Age 35-44 Correlation Summary
| Measurement | Dutch | Immigrants |
| Minimum | 65.4% | 77.4% |
| Maximum | 100.0% | 90.8% |
| Range | 34.6% | 13.4% |
| Mean | 87.4% | 83.8% |
| Median | 86.6% | 83.8% |
| Interquartile 25% (IQ1) | 83.8% | 82.9% |
| Interquartile 75% (IQ3) | 90.9% | 84.6% |
| Interquartile Range (IQR) | 7.0% | 1.7% |
| Standard Deviation (Sample) | 6.8% | 2.0% |
| Standard Deviation (Population) | 6.8% | 2.0% |
Similar Demographics by In Labor Force | Age 35-44
Demographics Similar to Dutch by In Labor Force | Age 35-44
In terms of in labor force | age 35-44, the demographic groups most similar to Dutch are Costa Rican (84.3%, a difference of 0.0%), Australian (84.3%, a difference of 0.0%), Immigrants from West Indies (84.3%, a difference of 0.010%), Korean (84.3%, a difference of 0.010%), and Barbadian (84.3%, a difference of 0.010%).
| Demographics | Rating | Rank | In Labor Force | Age 35-44 |
| Danes | 38.8 /100 | #180 | Fair 84.3% |
| Immigrants | West Indies | 36.4 /100 | #181 | Fair 84.3% |
| Koreans | 36.3 /100 | #182 | Fair 84.3% |
| Barbadians | 36.2 /100 | #183 | Fair 84.3% |
| Armenians | 35.6 /100 | #184 | Fair 84.3% |
| Costa Ricans | 35.3 /100 | #185 | Fair 84.3% |
| Australians | 35.1 /100 | #186 | Fair 84.3% |
| Dutch | 34.8 /100 | #187 | Fair 84.3% |
| South Africans | 34.1 /100 | #188 | Fair 84.3% |
| Immigrants | Denmark | 33.7 /100 | #189 | Fair 84.3% |
| Portuguese | 31.9 /100 | #190 | Fair 84.3% |
| Immigrants | Philippines | 27.9 /100 | #191 | Fair 84.2% |
| Immigrants | Vietnam | 27.4 /100 | #192 | Fair 84.2% |
| Hungarians | 26.8 /100 | #193 | Fair 84.2% |
| Immigrants | Indonesia | 25.7 /100 | #194 | Fair 84.2% |
Demographics Similar to Immigrants by In Labor Force | Age 35-44
In terms of in labor force | age 35-44, the demographic groups most similar to Immigrants are Guyanese (83.8%, a difference of 0.010%), Malaysian (83.8%, a difference of 0.010%), Immigrants from Cambodia (83.8%, a difference of 0.020%), Immigrants from Western Asia (83.8%, a difference of 0.020%), and Immigrants from Armenia (83.7%, a difference of 0.020%).
| Demographics | Rating | Rank | In Labor Force | Age 35-44 |
| Celtics | 1.4 /100 | #239 | Tragic 83.8% |
| Arabs | 1.3 /100 | #240 | Tragic 83.8% |
| Iraqis | 1.3 /100 | #241 | Tragic 83.8% |
| Immigrants | Cambodia | 1.1 /100 | #242 | Tragic 83.8% |
| Immigrants | Western Asia | 1.1 /100 | #243 | Tragic 83.8% |
| Guyanese | 1.1 /100 | #244 | Tragic 83.8% |
| Malaysians | 1.1 /100 | #245 | Tragic 83.8% |
| Immigrants | Immigrants | 1.0 /100 | #246 | Tragic 83.7% |
| Immigrants | Armenia | 0.9 /100 | #247 | Tragic 83.7% |
| Indonesians | 0.8 /100 | #248 | Tragic 83.7% |
| Immigrants | St. Vincent and the Grenadines | 0.7 /100 | #249 | Tragic 83.7% |
| Whites/Caucasians | 0.5 /100 | #250 | Tragic 83.6% |
| Salvadorans | 0.4 /100 | #251 | Tragic 83.6% |
| Immigrants | Guyana | 0.4 /100 | #252 | Tragic 83.6% |
| Lebanese | 0.4 /100 | #253 | Tragic 83.6% |