Syrian vs Immigrants from Jamaica In Labor Force | Age 35-44
COMPARE
Syrian
Immigrants from Jamaica
In Labor Force | Age 35-44
In Labor Force | Age 35-44 Comparison
Syrians
Immigrants from Jamaica
84.2%
IN LABOR FORCE | AGE 35-44
23.2/ 100
METRIC RATING
199th/ 347
METRIC RANK
84.6%
IN LABOR FORCE | AGE 35-44
79.4/ 100
METRIC RATING
144th/ 347
METRIC RANK
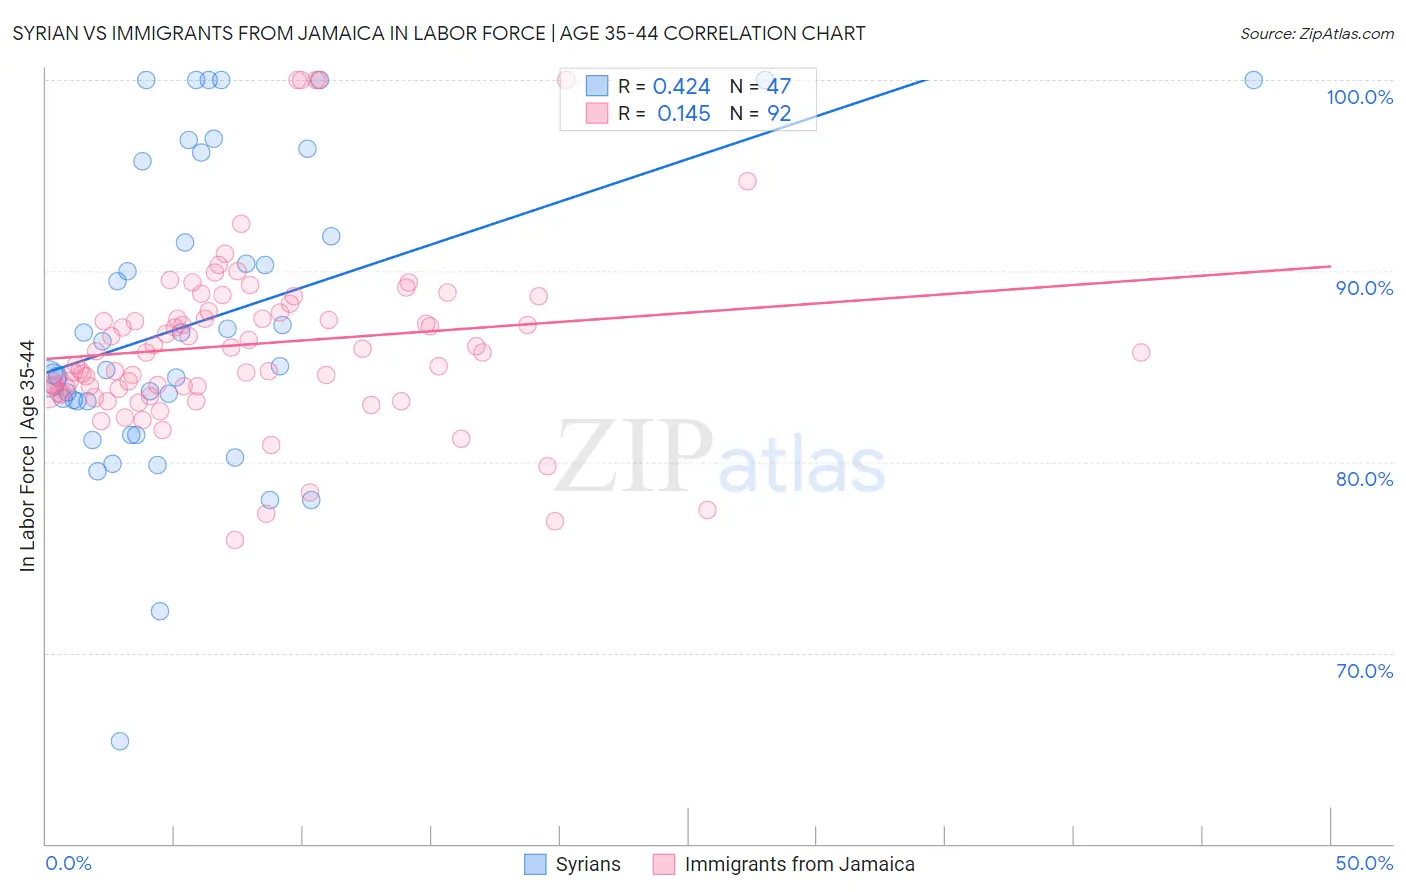
Syrian vs Immigrants from Jamaica In Labor Force | Age 35-44 Correlation Chart
The statistical analysis conducted on geographies consisting of 266,205,393 people shows a moderate positive correlation between the proportion of Syrians and labor force participation rate among population between the ages 35 and 44 in the United States with a correlation coefficient (R) of 0.424 and weighted average of 84.2%. Similarly, the statistical analysis conducted on geographies consisting of 301,667,003 people shows a poor positive correlation between the proportion of Immigrants from Jamaica and labor force participation rate among population between the ages 35 and 44 in the United States with a correlation coefficient (R) of 0.145 and weighted average of 84.6%, a difference of 0.41%.
In Labor Force | Age 35-44 Correlation Summary
| Measurement | Syrian | Immigrants from Jamaica |
| Minimum | 65.3% | 75.9% |
| Maximum | 100.0% | 100.0% |
| Range | 34.7% | 24.1% |
| Mean | 87.4% | 86.2% |
| Median | 85.0% | 85.7% |
| Interquartile 25% (IQ1) | 83.2% | 83.7% |
| Interquartile 75% (IQ3) | 95.7% | 87.9% |
| Interquartile Range (IQR) | 12.6% | 4.1% |
| Standard Deviation (Sample) | 8.0% | 4.7% |
| Standard Deviation (Population) | 8.0% | 4.6% |
Similar Demographics by In Labor Force | Age 35-44
Demographics Similar to Syrians by In Labor Force | Age 35-44
In terms of in labor force | age 35-44, the demographic groups most similar to Syrians are Moroccan (84.2%, a difference of 0.0%), British (84.2%, a difference of 0.0%), Immigrants from Uzbekistan (84.2%, a difference of 0.0%), Immigrants from Western Europe (84.2%, a difference of 0.010%), and Ecuadorian (84.2%, a difference of 0.010%).
| Demographics | Rating | Rank | In Labor Force | Age 35-44 |
| Immigrants | Vietnam | 27.4 /100 | #192 | Fair 84.2% |
| Hungarians | 26.8 /100 | #193 | Fair 84.2% |
| Immigrants | Indonesia | 25.7 /100 | #194 | Fair 84.2% |
| Immigrants | Caribbean | 25.7 /100 | #195 | Fair 84.2% |
| Immigrants | England | 25.0 /100 | #196 | Fair 84.2% |
| Immigrants | Western Europe | 24.7 /100 | #197 | Fair 84.2% |
| Ecuadorians | 24.0 /100 | #198 | Fair 84.2% |
| Syrians | 23.2 /100 | #199 | Fair 84.2% |
| Moroccans | 23.2 /100 | #200 | Fair 84.2% |
| British | 23.0 /100 | #201 | Fair 84.2% |
| Immigrants | Uzbekistan | 22.8 /100 | #202 | Fair 84.2% |
| Immigrants | South Eastern Asia | 22.4 /100 | #203 | Fair 84.2% |
| Canadians | 19.9 /100 | #204 | Poor 84.2% |
| Immigrants | Canada | 19.6 /100 | #205 | Poor 84.2% |
| Immigrants | Costa Rica | 19.5 /100 | #206 | Poor 84.2% |
Demographics Similar to Immigrants from Jamaica by In Labor Force | Age 35-44
In terms of in labor force | age 35-44, the demographic groups most similar to Immigrants from Jamaica are Immigrants from Ukraine (84.6%, a difference of 0.0%), Immigrants from Saudi Arabia (84.6%, a difference of 0.0%), Immigrants from Belgium (84.6%, a difference of 0.010%), Immigrants from Uruguay (84.6%, a difference of 0.010%), and Immigrants from Asia (84.5%, a difference of 0.010%).
| Demographics | Rating | Rank | In Labor Force | Age 35-44 |
| Immigrants | Chile | 84.6 /100 | #137 | Excellent 84.6% |
| Czechoslovakians | 82.6 /100 | #138 | Excellent 84.6% |
| Immigrants | Zaire | 82.5 /100 | #139 | Excellent 84.6% |
| Immigrants | Japan | 81.4 /100 | #140 | Excellent 84.6% |
| Immigrants | Belgium | 80.8 /100 | #141 | Excellent 84.6% |
| Immigrants | Uruguay | 80.1 /100 | #142 | Excellent 84.6% |
| Immigrants | Ukraine | 79.7 /100 | #143 | Good 84.6% |
| Immigrants | Jamaica | 79.4 /100 | #144 | Good 84.6% |
| Immigrants | Saudi Arabia | 79.4 /100 | #145 | Good 84.6% |
| Immigrants | Asia | 78.7 /100 | #146 | Good 84.5% |
| Immigrants | Netherlands | 76.6 /100 | #147 | Good 84.5% |
| South American Indians | 73.6 /100 | #148 | Good 84.5% |
| Okinawans | 73.5 /100 | #149 | Good 84.5% |
| Immigrants | Nigeria | 73.3 /100 | #150 | Good 84.5% |
| Romanians | 72.1 /100 | #151 | Good 84.5% |