Swedish vs Somali In Labor Force | Age 20-64
COMPARE
Swedish
Somali
In Labor Force | Age 20-64
In Labor Force | Age 20-64 Comparison
Swedes
Somalis
80.3%
IN LABOR FORCE | AGE 20-64
98.9/ 100
METRIC RATING
59th/ 347
METRIC RANK
81.6%
IN LABOR FORCE | AGE 20-64
100.0/ 100
METRIC RATING
6th/ 347
METRIC RANK
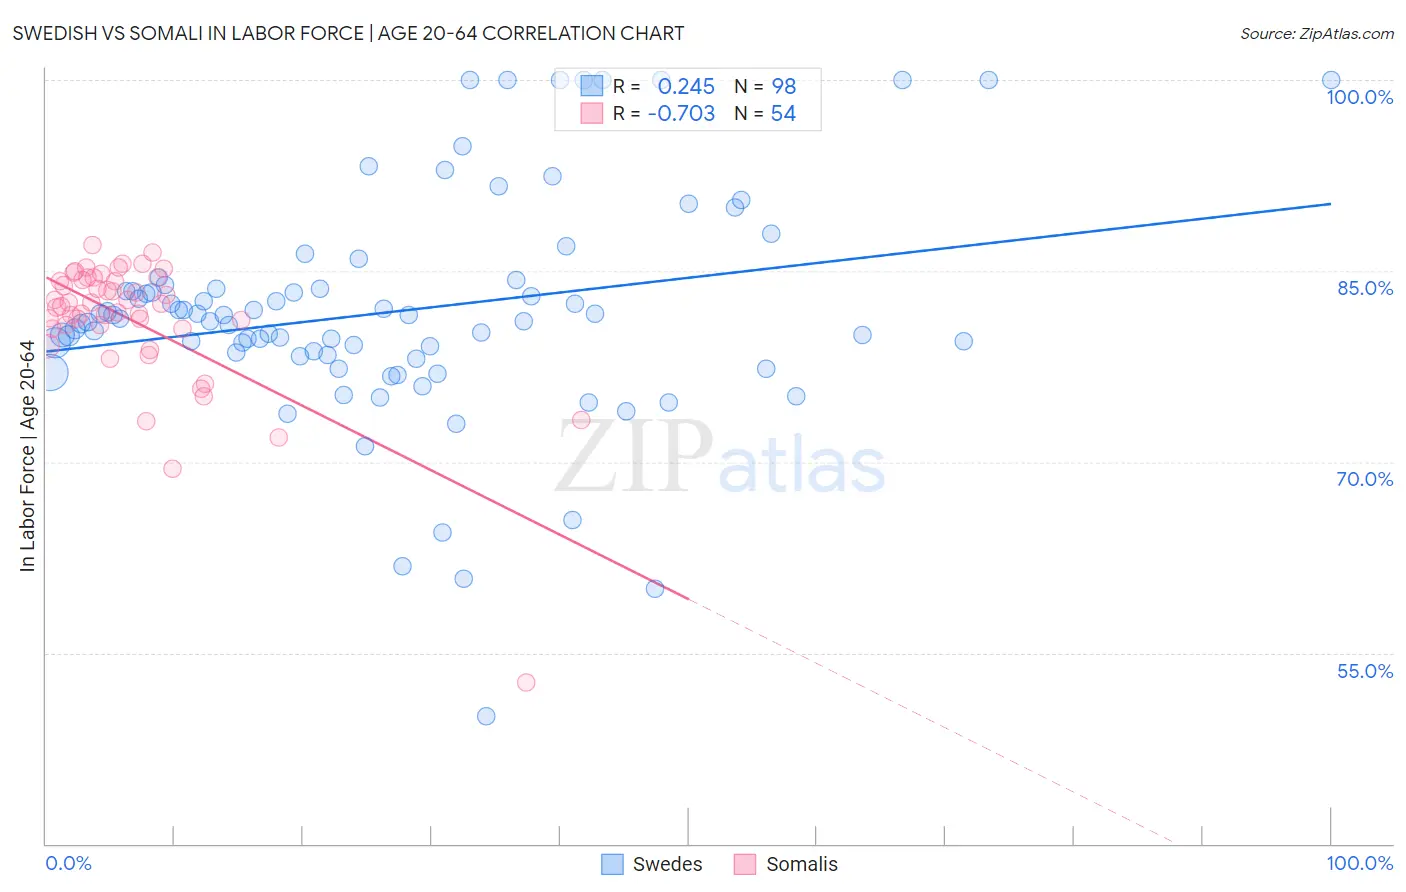
Swedish vs Somali In Labor Force | Age 20-64 Correlation Chart
The statistical analysis conducted on geographies consisting of 539,244,386 people shows a weak positive correlation between the proportion of Swedes and labor force participation rate among population between the ages 20 and 64 in the United States with a correlation coefficient (R) of 0.245 and weighted average of 80.3%. Similarly, the statistical analysis conducted on geographies consisting of 99,331,399 people shows a strong negative correlation between the proportion of Somalis and labor force participation rate among population between the ages 20 and 64 in the United States with a correlation coefficient (R) of -0.703 and weighted average of 81.6%, a difference of 1.7%.
In Labor Force | Age 20-64 Correlation Summary
| Measurement | Swedish | Somali |
| Minimum | 50.0% | 52.7% |
| Maximum | 100.0% | 87.1% |
| Range | 50.0% | 34.4% |
| Mean | 81.8% | 81.0% |
| Median | 81.2% | 82.3% |
| Interquartile 25% (IQ1) | 78.4% | 80.5% |
| Interquartile 75% (IQ3) | 83.6% | 84.3% |
| Interquartile Range (IQR) | 5.2% | 3.8% |
| Standard Deviation (Sample) | 8.9% | 5.5% |
| Standard Deviation (Population) | 8.9% | 5.4% |
Similar Demographics by In Labor Force | Age 20-64
Demographics Similar to Swedes by In Labor Force | Age 20-64
In terms of in labor force | age 20-64, the demographic groups most similar to Swedes are Serbian (80.3%, a difference of 0.0%), Tongan (80.3%, a difference of 0.0%), Afghan (80.3%, a difference of 0.010%), Burmese (80.3%, a difference of 0.010%), and Carpatho Rusyn (80.3%, a difference of 0.010%).
| Demographics | Rating | Rank | In Labor Force | Age 20-64 |
| Turks | 99.2 /100 | #52 | Exceptional 80.3% |
| Immigrants | Peru | 99.2 /100 | #53 | Exceptional 80.3% |
| Peruvians | 99.1 /100 | #54 | Exceptional 80.3% |
| Immigrants | Cabo Verde | 99.0 /100 | #55 | Exceptional 80.3% |
| Immigrants | Northern Africa | 99.0 /100 | #56 | Exceptional 80.3% |
| Afghans | 98.9 /100 | #57 | Exceptional 80.3% |
| Serbians | 98.9 /100 | #58 | Exceptional 80.3% |
| Swedes | 98.9 /100 | #59 | Exceptional 80.3% |
| Tongans | 98.8 /100 | #60 | Exceptional 80.3% |
| Burmese | 98.8 /100 | #61 | Exceptional 80.3% |
| Carpatho Rusyns | 98.8 /100 | #62 | Exceptional 80.3% |
| Immigrants | Korea | 98.8 /100 | #63 | Exceptional 80.3% |
| Immigrants | Albania | 98.7 /100 | #64 | Exceptional 80.3% |
| Lithuanians | 98.7 /100 | #65 | Exceptional 80.2% |
| Macedonians | 98.7 /100 | #66 | Exceptional 80.2% |
Demographics Similar to Somalis by In Labor Force | Age 20-64
In terms of in labor force | age 20-64, the demographic groups most similar to Somalis are Immigrants from Cameroon (81.6%, a difference of 0.040%), Immigrants from Somalia (81.6%, a difference of 0.060%), Sierra Leonean (81.5%, a difference of 0.060%), Bolivian (81.7%, a difference of 0.11%), and Immigrants from Sierra Leone (81.5%, a difference of 0.18%).
| Demographics | Rating | Rank | In Labor Force | Age 20-64 |
| Immigrants | Ethiopia | 100.0 /100 | #1 | Exceptional 82.1% |
| Ethiopians | 100.0 /100 | #2 | Exceptional 82.0% |
| Immigrants | Bolivia | 100.0 /100 | #3 | Exceptional 81.9% |
| Luxembourgers | 100.0 /100 | #4 | Exceptional 81.9% |
| Bolivians | 100.0 /100 | #5 | Exceptional 81.7% |
| Somalis | 100.0 /100 | #6 | Exceptional 81.6% |
| Immigrants | Cameroon | 100.0 /100 | #7 | Exceptional 81.6% |
| Immigrants | Somalia | 100.0 /100 | #8 | Exceptional 81.6% |
| Sierra Leoneans | 100.0 /100 | #9 | Exceptional 81.5% |
| Immigrants | Sierra Leone | 100.0 /100 | #10 | Exceptional 81.5% |
| Immigrants | Eastern Africa | 100.0 /100 | #11 | Exceptional 81.3% |
| Immigrants | Eritrea | 100.0 /100 | #12 | Exceptional 81.3% |
| Immigrants | India | 100.0 /100 | #13 | Exceptional 81.3% |
| Cambodians | 100.0 /100 | #14 | Exceptional 81.1% |
| Bulgarians | 100.0 /100 | #15 | Exceptional 81.1% |