Sudanese vs Immigrants from Panama In Labor Force | Age 20-64
COMPARE
Sudanese
Immigrants from Panama
In Labor Force | Age 20-64
In Labor Force | Age 20-64 Comparison
Sudanese
Immigrants from Panama
80.8%
IN LABOR FORCE | AGE 20-64
100.0/ 100
METRIC RATING
22nd/ 347
METRIC RANK
79.1%
IN LABOR FORCE | AGE 20-64
6.9/ 100
METRIC RATING
222nd/ 347
METRIC RANK
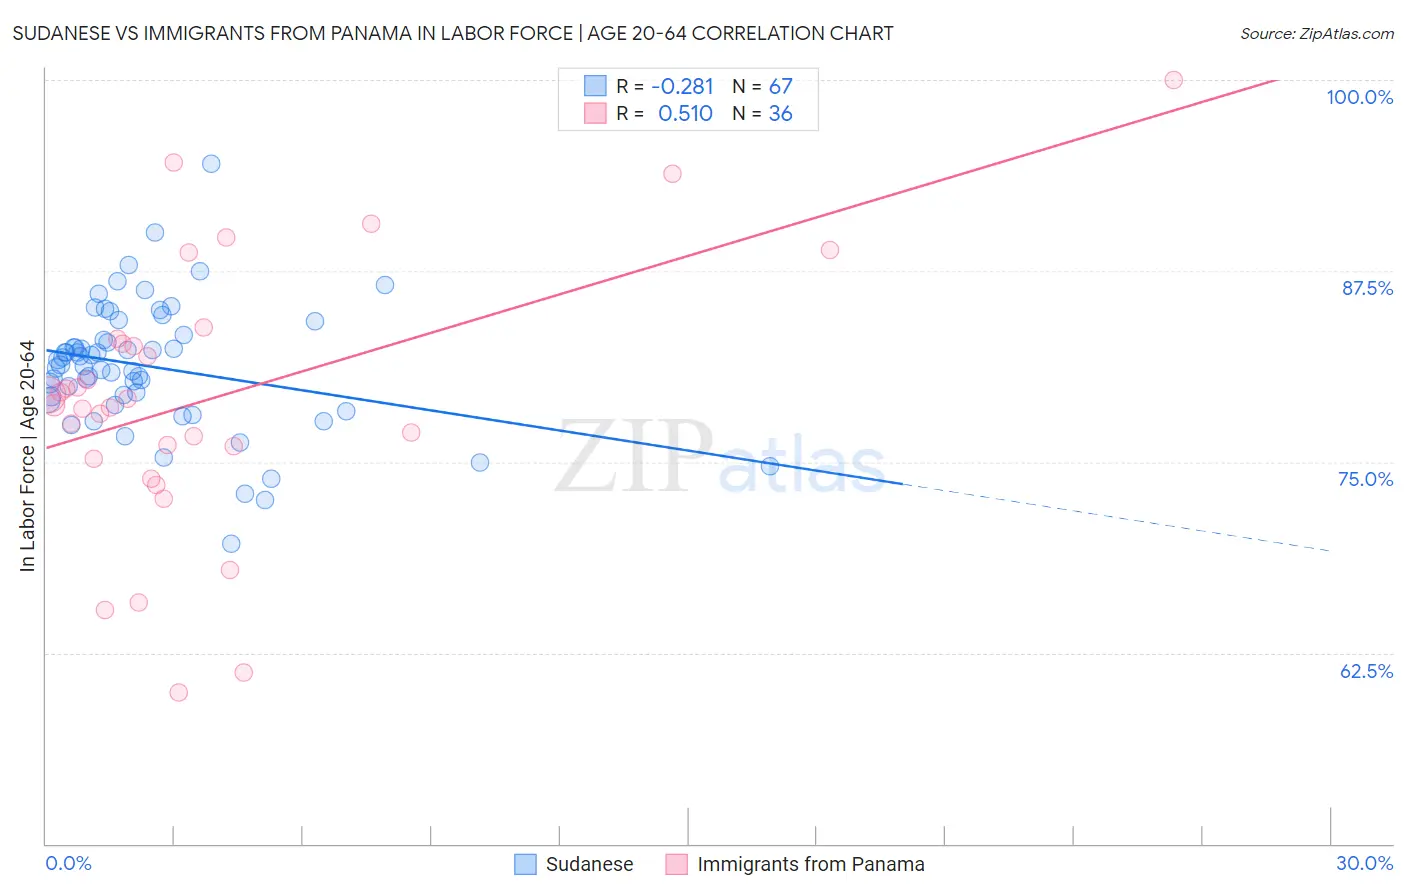
Sudanese vs Immigrants from Panama In Labor Force | Age 20-64 Correlation Chart
The statistical analysis conducted on geographies consisting of 110,143,017 people shows a weak negative correlation between the proportion of Sudanese and labor force participation rate among population between the ages 20 and 64 in the United States with a correlation coefficient (R) of -0.281 and weighted average of 80.8%. Similarly, the statistical analysis conducted on geographies consisting of 221,185,422 people shows a substantial positive correlation between the proportion of Immigrants from Panama and labor force participation rate among population between the ages 20 and 64 in the United States with a correlation coefficient (R) of 0.510 and weighted average of 79.1%, a difference of 2.1%.
In Labor Force | Age 20-64 Correlation Summary
| Measurement | Sudanese | Immigrants from Panama |
| Minimum | 69.6% | 59.9% |
| Maximum | 94.5% | 100.0% |
| Range | 24.9% | 40.1% |
| Mean | 81.2% | 79.2% |
| Median | 81.4% | 78.9% |
| Interquartile 25% (IQ1) | 79.1% | 75.6% |
| Interquartile 75% (IQ3) | 83.3% | 82.9% |
| Interquartile Range (IQR) | 4.2% | 7.3% |
| Standard Deviation (Sample) | 4.2% | 8.8% |
| Standard Deviation (Population) | 4.2% | 8.7% |
Similar Demographics by In Labor Force | Age 20-64
Demographics Similar to Sudanese by In Labor Force | Age 20-64
In terms of in labor force | age 20-64, the demographic groups most similar to Sudanese are Immigrants from Bosnia and Herzegovina (80.8%, a difference of 0.0%), Immigrants from Morocco (80.8%, a difference of 0.020%), Kenyan (80.8%, a difference of 0.030%), Immigrants from Serbia (80.8%, a difference of 0.050%), and Liberian (80.9%, a difference of 0.070%).
| Demographics | Rating | Rank | In Labor Force | Age 20-64 |
| Bulgarians | 100.0 /100 | #15 | Exceptional 81.1% |
| Immigrants | Nepal | 100.0 /100 | #16 | Exceptional 81.1% |
| Norwegians | 100.0 /100 | #17 | Exceptional 81.0% |
| Immigrants | Bulgaria | 100.0 /100 | #18 | Exceptional 81.0% |
| Zimbabweans | 100.0 /100 | #19 | Exceptional 81.0% |
| Thais | 100.0 /100 | #20 | Exceptional 80.9% |
| Liberians | 100.0 /100 | #21 | Exceptional 80.9% |
| Sudanese | 100.0 /100 | #22 | Exceptional 80.8% |
| Immigrants | Bosnia and Herzegovina | 100.0 /100 | #23 | Exceptional 80.8% |
| Immigrants | Morocco | 100.0 /100 | #24 | Exceptional 80.8% |
| Kenyans | 100.0 /100 | #25 | Exceptional 80.8% |
| Immigrants | Serbia | 100.0 /100 | #26 | Exceptional 80.8% |
| Immigrants | Kenya | 99.9 /100 | #27 | Exceptional 80.7% |
| Immigrants | Uganda | 99.9 /100 | #28 | Exceptional 80.7% |
| Immigrants | South Central Asia | 99.9 /100 | #29 | Exceptional 80.7% |
Demographics Similar to Immigrants from Panama by In Labor Force | Age 20-64
In terms of in labor force | age 20-64, the demographic groups most similar to Immigrants from Panama are Canadian (79.1%, a difference of 0.0%), Immigrants from Uzbekistan (79.1%, a difference of 0.0%), Hungarian (79.2%, a difference of 0.010%), Portuguese (79.1%, a difference of 0.020%), and Immigrants (79.2%, a difference of 0.030%).
| Demographics | Rating | Rank | In Labor Force | Age 20-64 |
| Immigrants | Norway | 12.0 /100 | #215 | Poor 79.2% |
| Arabs | 11.4 /100 | #216 | Poor 79.2% |
| Immigrants | Western Asia | 11.0 /100 | #217 | Poor 79.2% |
| Immigrants | England | 9.3 /100 | #218 | Tragic 79.2% |
| French Canadians | 8.4 /100 | #219 | Tragic 79.2% |
| Immigrants | Immigrants | 7.7 /100 | #220 | Tragic 79.2% |
| Hungarians | 7.2 /100 | #221 | Tragic 79.2% |
| Immigrants | Panama | 6.9 /100 | #222 | Tragic 79.1% |
| Canadians | 6.8 /100 | #223 | Tragic 79.1% |
| Immigrants | Uzbekistan | 6.8 /100 | #224 | Tragic 79.1% |
| Portuguese | 6.4 /100 | #225 | Tragic 79.1% |
| Central Americans | 5.9 /100 | #226 | Tragic 79.1% |
| Immigrants | Western Europe | 5.9 /100 | #227 | Tragic 79.1% |
| Panamanians | 5.7 /100 | #228 | Tragic 79.1% |
| Alsatians | 5.7 /100 | #229 | Tragic 79.1% |