Subsaharan African vs Immigrants from Europe In Labor Force | Age 20-24
COMPARE
Subsaharan African
Immigrants from Europe
In Labor Force | Age 20-24
In Labor Force | Age 20-24 Comparison
Sub-Saharan Africans
Immigrants from Europe
75.7%
IN LABOR FORCE | AGE 20-24
90.9/ 100
METRIC RATING
127th/ 347
METRIC RANK
74.8%
IN LABOR FORCE | AGE 20-24
27.5/ 100
METRIC RATING
192nd/ 347
METRIC RANK
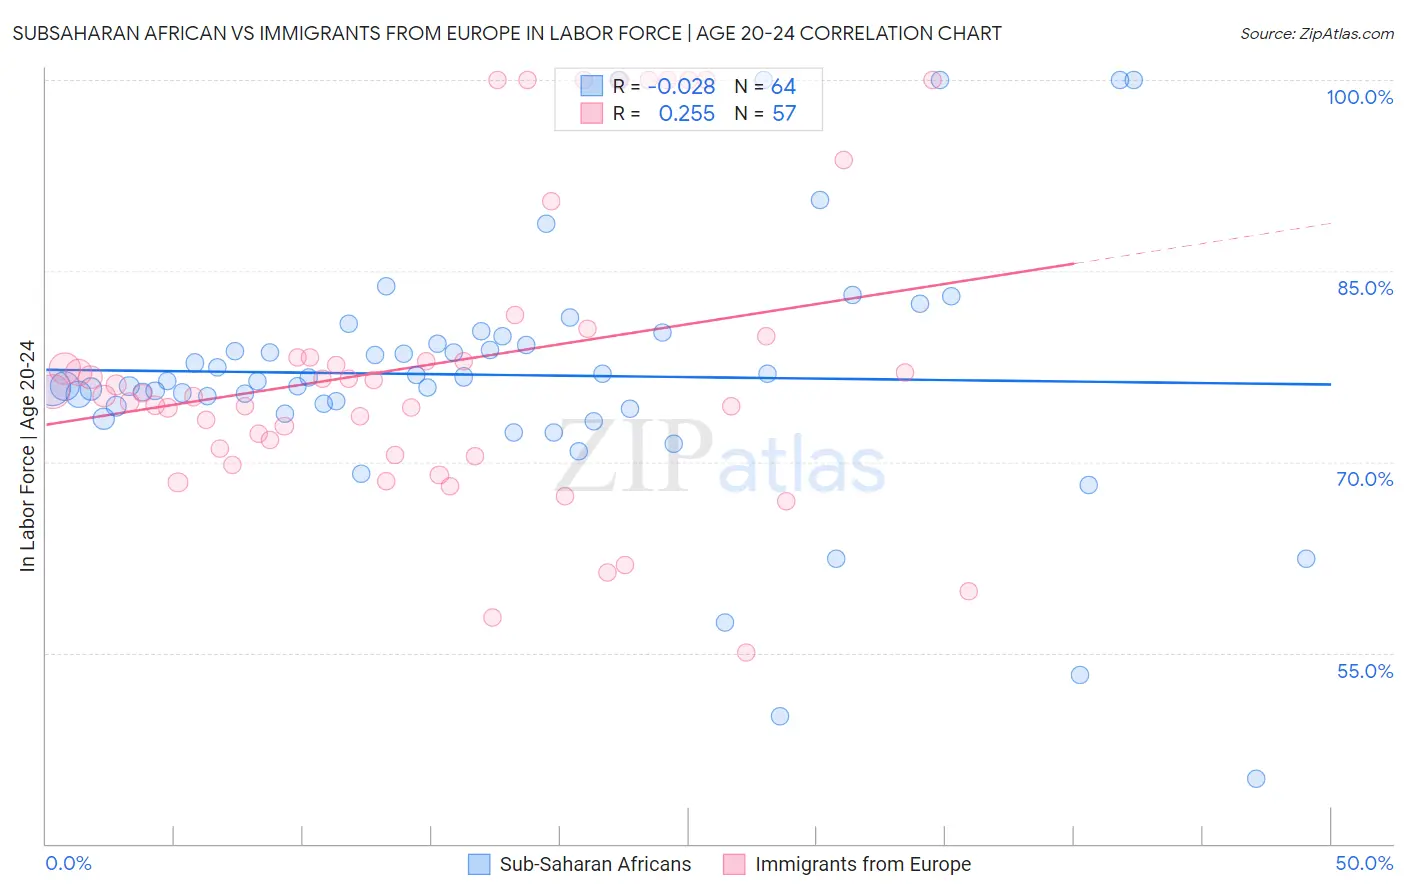
Subsaharan African vs Immigrants from Europe In Labor Force | Age 20-24 Correlation Chart
The statistical analysis conducted on geographies consisting of 507,882,166 people shows no correlation between the proportion of Sub-Saharan Africans and labor force participation rate among population between the ages 20 and 24 in the United States with a correlation coefficient (R) of -0.028 and weighted average of 75.7%. Similarly, the statistical analysis conducted on geographies consisting of 546,529,081 people shows a weak positive correlation between the proportion of Immigrants from Europe and labor force participation rate among population between the ages 20 and 24 in the United States with a correlation coefficient (R) of 0.255 and weighted average of 74.8%, a difference of 1.2%.
In Labor Force | Age 20-24 Correlation Summary
| Measurement | Subsaharan African | Immigrants from Europe |
| Minimum | 45.1% | 55.0% |
| Maximum | 100.0% | 100.0% |
| Range | 54.9% | 45.0% |
| Mean | 76.8% | 77.7% |
| Median | 76.3% | 75.4% |
| Interquartile 25% (IQ1) | 74.3% | 70.8% |
| Interquartile 75% (IQ3) | 79.6% | 79.1% |
| Interquartile Range (IQR) | 5.3% | 8.3% |
| Standard Deviation (Sample) | 10.3% | 11.7% |
| Standard Deviation (Population) | 10.2% | 11.6% |
Similar Demographics by In Labor Force | Age 20-24
Demographics Similar to Sub-Saharan Africans by In Labor Force | Age 20-24
In terms of in labor force | age 20-24, the demographic groups most similar to Sub-Saharan Africans are Immigrants from Afghanistan (75.6%, a difference of 0.060%), Iroquois (75.6%, a difference of 0.070%), Immigrants from Austria (75.6%, a difference of 0.080%), Immigrants from Jordan (75.6%, a difference of 0.090%), and Palestinian (75.6%, a difference of 0.10%).
| Demographics | Rating | Rank | In Labor Force | Age 20-24 |
| Immigrants | Africa | 94.6 /100 | #120 | Exceptional 75.8% |
| Immigrants | Serbia | 94.3 /100 | #121 | Exceptional 75.8% |
| Pakistanis | 94.1 /100 | #122 | Exceptional 75.8% |
| Immigrants | Bulgaria | 94.1 /100 | #123 | Exceptional 75.8% |
| Immigrants | Sierra Leone | 93.8 /100 | #124 | Exceptional 75.8% |
| Immigrants | Scotland | 93.7 /100 | #125 | Exceptional 75.8% |
| Brazilians | 93.0 /100 | #126 | Exceptional 75.8% |
| Sub-Saharan Africans | 90.9 /100 | #127 | Exceptional 75.7% |
| Immigrants | Afghanistan | 89.4 /100 | #128 | Excellent 75.6% |
| Iroquois | 89.1 /100 | #129 | Excellent 75.6% |
| Immigrants | Austria | 88.8 /100 | #130 | Excellent 75.6% |
| Immigrants | Jordan | 88.5 /100 | #131 | Excellent 75.6% |
| Palestinians | 88.4 /100 | #132 | Excellent 75.6% |
| Zimbabweans | 88.2 /100 | #133 | Excellent 75.6% |
| Estonians | 87.1 /100 | #134 | Excellent 75.6% |
Demographics Similar to Immigrants from Europe by In Labor Force | Age 20-24
In terms of in labor force | age 20-24, the demographic groups most similar to Immigrants from Europe are Senegalese (74.8%, a difference of 0.010%), Alsatian (74.8%, a difference of 0.010%), Immigrants from Denmark (74.8%, a difference of 0.030%), Eastern European (74.8%, a difference of 0.040%), and Immigrants from Vietnam (74.7%, a difference of 0.050%).
| Demographics | Rating | Rank | In Labor Force | Age 20-24 |
| Sri Lankans | 34.9 /100 | #185 | Fair 74.9% |
| Immigrants | Eastern Europe | 33.8 /100 | #186 | Fair 74.9% |
| Immigrants | Honduras | 33.5 /100 | #187 | Fair 74.9% |
| Hondurans | 32.7 /100 | #188 | Fair 74.8% |
| Immigrants | Northern Europe | 32.6 /100 | #189 | Fair 74.8% |
| Russians | 32.2 /100 | #190 | Fair 74.8% |
| Senegalese | 28.1 /100 | #191 | Fair 74.8% |
| Immigrants | Europe | 27.5 /100 | #192 | Fair 74.8% |
| Alsatians | 27.1 /100 | #193 | Fair 74.8% |
| Immigrants | Denmark | 25.8 /100 | #194 | Fair 74.8% |
| Eastern Europeans | 25.4 /100 | #195 | Fair 74.8% |
| Immigrants | Vietnam | 25.1 /100 | #196 | Fair 74.7% |
| Panamanians | 25.0 /100 | #197 | Fair 74.7% |
| Immigrants | Nigeria | 24.2 /100 | #198 | Fair 74.7% |
| Taiwanese | 23.2 /100 | #199 | Fair 74.7% |