Vietnamese vs Immigrants from Europe In Labor Force | Age 20-24
COMPARE
Vietnamese
Immigrants from Europe
In Labor Force | Age 20-24
In Labor Force | Age 20-24 Comparison
Vietnamese
Immigrants from Europe
70.6%
IN LABOR FORCE | AGE 20-24
0.0/ 100
METRIC RATING
330th/ 347
METRIC RANK
74.8%
IN LABOR FORCE | AGE 20-24
27.5/ 100
METRIC RATING
192nd/ 347
METRIC RANK
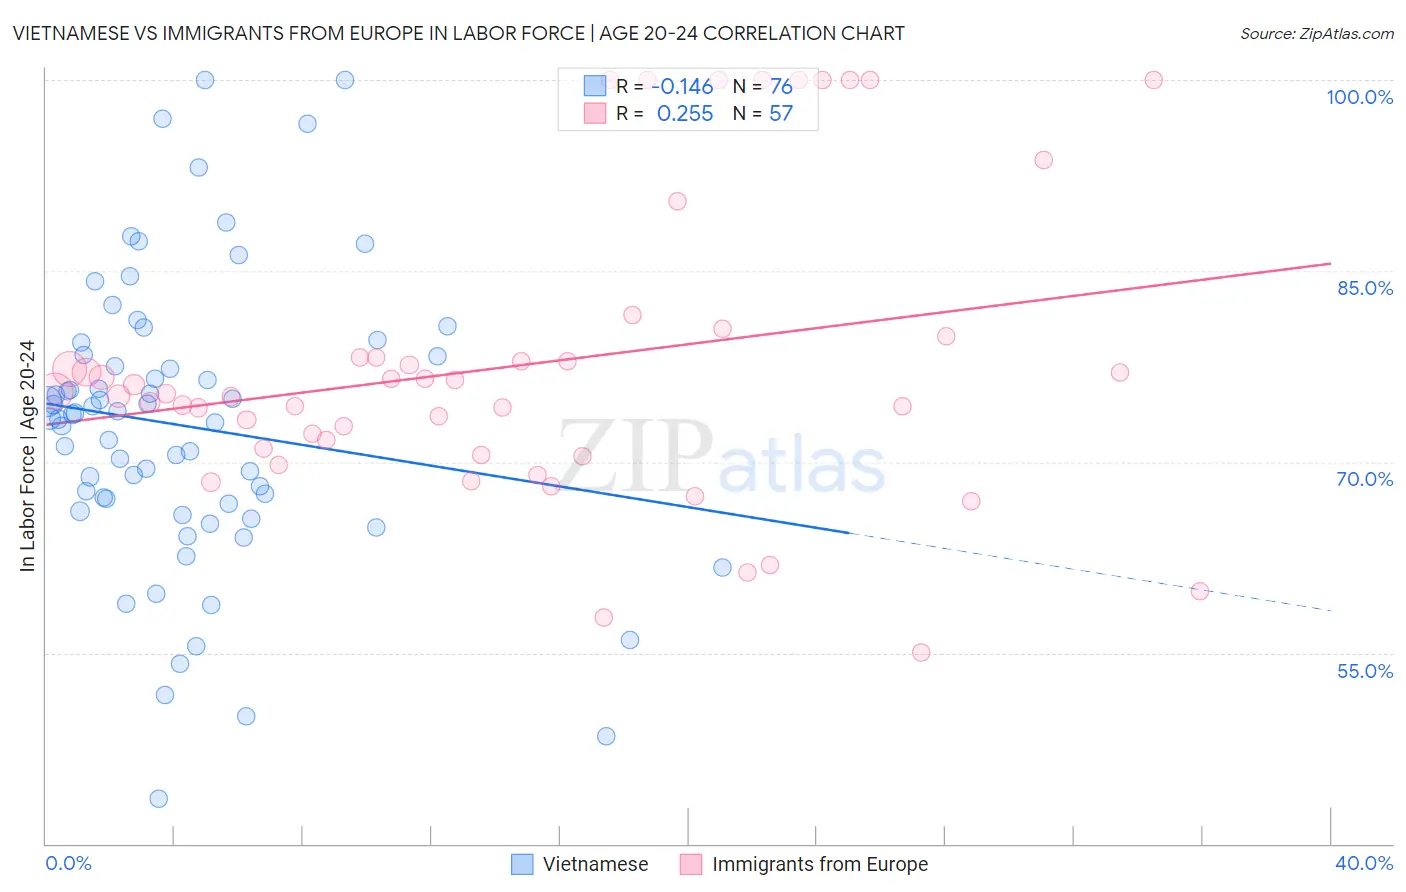
Vietnamese vs Immigrants from Europe In Labor Force | Age 20-24 Correlation Chart
The statistical analysis conducted on geographies consisting of 170,753,724 people shows a poor negative correlation between the proportion of Vietnamese and labor force participation rate among population between the ages 20 and 24 in the United States with a correlation coefficient (R) of -0.146 and weighted average of 70.6%. Similarly, the statistical analysis conducted on geographies consisting of 546,529,081 people shows a weak positive correlation between the proportion of Immigrants from Europe and labor force participation rate among population between the ages 20 and 24 in the United States with a correlation coefficient (R) of 0.255 and weighted average of 74.8%, a difference of 5.9%.
In Labor Force | Age 20-24 Correlation Summary
| Measurement | Vietnamese | Immigrants from Europe |
| Minimum | 43.5% | 55.0% |
| Maximum | 100.0% | 100.0% |
| Range | 56.5% | 45.0% |
| Mean | 72.8% | 77.7% |
| Median | 73.6% | 75.4% |
| Interquartile 25% (IQ1) | 66.4% | 70.8% |
| Interquartile 75% (IQ3) | 78.3% | 79.1% |
| Interquartile Range (IQR) | 11.9% | 8.3% |
| Standard Deviation (Sample) | 11.4% | 11.7% |
| Standard Deviation (Population) | 11.3% | 11.6% |
Similar Demographics by In Labor Force | Age 20-24
Demographics Similar to Vietnamese by In Labor Force | Age 20-24
In terms of in labor force | age 20-24, the demographic groups most similar to Vietnamese are Immigrants from Bangladesh (70.6%, a difference of 0.020%), Immigrants from Uzbekistan (70.4%, a difference of 0.33%), Yup'ik (70.9%, a difference of 0.35%), Yuman (70.3%, a difference of 0.55%), and Immigrants from China (71.1%, a difference of 0.59%).
| Demographics | Rating | Rank | In Labor Force | Age 20-24 |
| West Indians | 0.0 /100 | #323 | Tragic 71.3% |
| Immigrants | Dominican Republic | 0.0 /100 | #324 | Tragic 71.2% |
| Barbadians | 0.0 /100 | #325 | Tragic 71.1% |
| Dominicans | 0.0 /100 | #326 | Tragic 71.1% |
| Immigrants | Trinidad and Tobago | 0.0 /100 | #327 | Tragic 71.1% |
| Immigrants | China | 0.0 /100 | #328 | Tragic 71.1% |
| Yup'ik | 0.0 /100 | #329 | Tragic 70.9% |
| Vietnamese | 0.0 /100 | #330 | Tragic 70.6% |
| Immigrants | Bangladesh | 0.0 /100 | #331 | Tragic 70.6% |
| Immigrants | Uzbekistan | 0.0 /100 | #332 | Tragic 70.4% |
| Yuman | 0.0 /100 | #333 | Tragic 70.3% |
| British West Indians | 0.0 /100 | #334 | Tragic 70.0% |
| Immigrants | Barbados | 0.0 /100 | #335 | Tragic 69.7% |
| Immigrants | Guyana | 0.0 /100 | #336 | Tragic 69.3% |
| Guyanese | 0.0 /100 | #337 | Tragic 69.2% |
Demographics Similar to Immigrants from Europe by In Labor Force | Age 20-24
In terms of in labor force | age 20-24, the demographic groups most similar to Immigrants from Europe are Senegalese (74.8%, a difference of 0.010%), Alsatian (74.8%, a difference of 0.010%), Immigrants from Denmark (74.8%, a difference of 0.030%), Eastern European (74.8%, a difference of 0.040%), and Immigrants from Vietnam (74.7%, a difference of 0.050%).
| Demographics | Rating | Rank | In Labor Force | Age 20-24 |
| Sri Lankans | 34.9 /100 | #185 | Fair 74.9% |
| Immigrants | Eastern Europe | 33.8 /100 | #186 | Fair 74.9% |
| Immigrants | Honduras | 33.5 /100 | #187 | Fair 74.9% |
| Hondurans | 32.7 /100 | #188 | Fair 74.8% |
| Immigrants | Northern Europe | 32.6 /100 | #189 | Fair 74.8% |
| Russians | 32.2 /100 | #190 | Fair 74.8% |
| Senegalese | 28.1 /100 | #191 | Fair 74.8% |
| Immigrants | Europe | 27.5 /100 | #192 | Fair 74.8% |
| Alsatians | 27.1 /100 | #193 | Fair 74.8% |
| Immigrants | Denmark | 25.8 /100 | #194 | Fair 74.8% |
| Eastern Europeans | 25.4 /100 | #195 | Fair 74.8% |
| Immigrants | Vietnam | 25.1 /100 | #196 | Fair 74.7% |
| Panamanians | 25.0 /100 | #197 | Fair 74.7% |
| Immigrants | Nigeria | 24.2 /100 | #198 | Fair 74.7% |
| Taiwanese | 23.2 /100 | #199 | Fair 74.7% |