Immigrants from Sweden vs Immigrants from Europe In Labor Force | Age 20-24
COMPARE
Immigrants from Sweden
Immigrants from Europe
In Labor Force | Age 20-24
In Labor Force | Age 20-24 Comparison
Immigrants from Sweden
Immigrants from Europe
74.2%
IN LABOR FORCE | AGE 20-24
4.6/ 100
METRIC RATING
229th/ 347
METRIC RANK
74.8%
IN LABOR FORCE | AGE 20-24
27.5/ 100
METRIC RATING
192nd/ 347
METRIC RANK
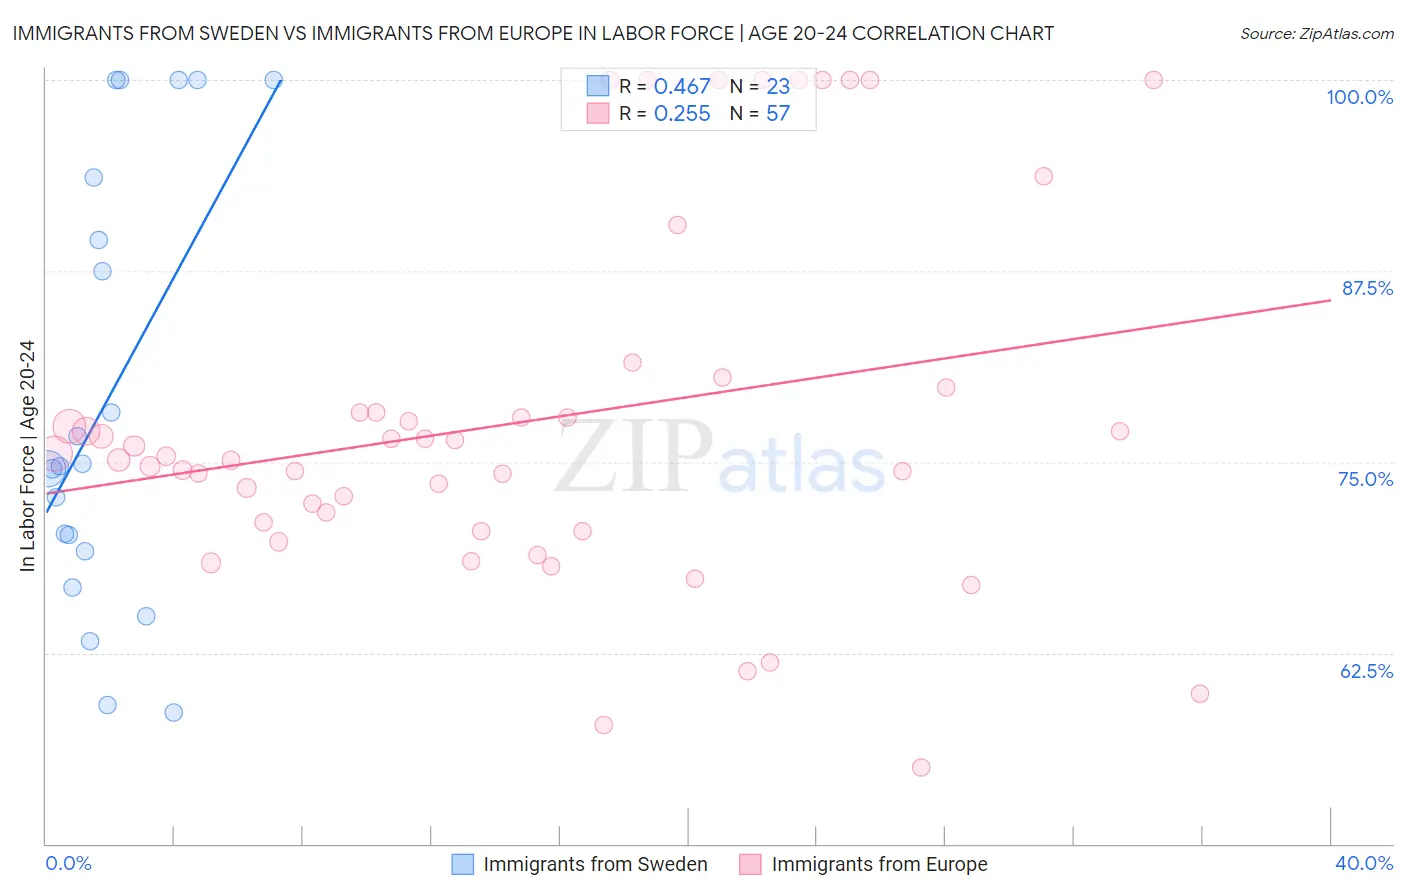
Immigrants from Sweden vs Immigrants from Europe In Labor Force | Age 20-24 Correlation Chart
The statistical analysis conducted on geographies consisting of 164,691,562 people shows a moderate positive correlation between the proportion of Immigrants from Sweden and labor force participation rate among population between the ages 20 and 24 in the United States with a correlation coefficient (R) of 0.467 and weighted average of 74.2%. Similarly, the statistical analysis conducted on geographies consisting of 546,529,081 people shows a weak positive correlation between the proportion of Immigrants from Europe and labor force participation rate among population between the ages 20 and 24 in the United States with a correlation coefficient (R) of 0.255 and weighted average of 74.8%, a difference of 0.76%.
In Labor Force | Age 20-24 Correlation Summary
| Measurement | Immigrants from Sweden | Immigrants from Europe |
| Minimum | 58.6% | 55.0% |
| Maximum | 100.0% | 100.0% |
| Range | 41.4% | 45.0% |
| Mean | 79.1% | 77.7% |
| Median | 74.7% | 75.4% |
| Interquartile 25% (IQ1) | 69.2% | 70.8% |
| Interquartile 75% (IQ3) | 93.6% | 79.1% |
| Interquartile Range (IQR) | 24.4% | 8.3% |
| Standard Deviation (Sample) | 14.1% | 11.7% |
| Standard Deviation (Population) | 13.8% | 11.6% |
Similar Demographics by In Labor Force | Age 20-24
Demographics Similar to Immigrants from Sweden by In Labor Force | Age 20-24
In terms of in labor force | age 20-24, the demographic groups most similar to Immigrants from Sweden are Immigrants from Albania (74.2%, a difference of 0.030%), Immigrants from Ukraine (74.2%, a difference of 0.040%), Immigrants from Greece (74.2%, a difference of 0.040%), Immigrants from Switzerland (74.2%, a difference of 0.050%), and Immigrants from Fiji (74.3%, a difference of 0.090%).
| Demographics | Rating | Rank | In Labor Force | Age 20-24 |
| Immigrants | India | 9.9 /100 | #222 | Tragic 74.4% |
| Hispanics or Latinos | 7.9 /100 | #223 | Tragic 74.4% |
| Seminole | 6.9 /100 | #224 | Tragic 74.3% |
| Ghanaians | 6.2 /100 | #225 | Tragic 74.3% |
| Immigrants | Fiji | 5.9 /100 | #226 | Tragic 74.3% |
| Immigrants | Ireland | 5.8 /100 | #227 | Tragic 74.3% |
| Immigrants | Ukraine | 5.1 /100 | #228 | Tragic 74.2% |
| Immigrants | Sweden | 4.6 /100 | #229 | Tragic 74.2% |
| Immigrants | Albania | 4.3 /100 | #230 | Tragic 74.2% |
| Immigrants | Greece | 4.1 /100 | #231 | Tragic 74.2% |
| Immigrants | Switzerland | 4.1 /100 | #232 | Tragic 74.2% |
| Immigrants | Chile | 3.7 /100 | #233 | Tragic 74.1% |
| Immigrants | Immigrants | 3.6 /100 | #234 | Tragic 74.1% |
| Laotians | 3.5 /100 | #235 | Tragic 74.1% |
| Immigrants | France | 3.3 /100 | #236 | Tragic 74.1% |
Demographics Similar to Immigrants from Europe by In Labor Force | Age 20-24
In terms of in labor force | age 20-24, the demographic groups most similar to Immigrants from Europe are Senegalese (74.8%, a difference of 0.010%), Alsatian (74.8%, a difference of 0.010%), Immigrants from Denmark (74.8%, a difference of 0.030%), Eastern European (74.8%, a difference of 0.040%), and Immigrants from Vietnam (74.7%, a difference of 0.050%).
| Demographics | Rating | Rank | In Labor Force | Age 20-24 |
| Sri Lankans | 34.9 /100 | #185 | Fair 74.9% |
| Immigrants | Eastern Europe | 33.8 /100 | #186 | Fair 74.9% |
| Immigrants | Honduras | 33.5 /100 | #187 | Fair 74.9% |
| Hondurans | 32.7 /100 | #188 | Fair 74.8% |
| Immigrants | Northern Europe | 32.6 /100 | #189 | Fair 74.8% |
| Russians | 32.2 /100 | #190 | Fair 74.8% |
| Senegalese | 28.1 /100 | #191 | Fair 74.8% |
| Immigrants | Europe | 27.5 /100 | #192 | Fair 74.8% |
| Alsatians | 27.1 /100 | #193 | Fair 74.8% |
| Immigrants | Denmark | 25.8 /100 | #194 | Fair 74.8% |
| Eastern Europeans | 25.4 /100 | #195 | Fair 74.8% |
| Immigrants | Vietnam | 25.1 /100 | #196 | Fair 74.7% |
| Panamanians | 25.0 /100 | #197 | Fair 74.7% |
| Immigrants | Nigeria | 24.2 /100 | #198 | Fair 74.7% |
| Taiwanese | 23.2 /100 | #199 | Fair 74.7% |