Subsaharan African vs Burmese In Labor Force | Age 20-24
COMPARE
Subsaharan African
Burmese
In Labor Force | Age 20-24
In Labor Force | Age 20-24 Comparison
Sub-Saharan Africans
Burmese
75.7%
IN LABOR FORCE | AGE 20-24
90.9/ 100
METRIC RATING
127th/ 347
METRIC RANK
73.6%
IN LABOR FORCE | AGE 20-24
0.5/ 100
METRIC RATING
265th/ 347
METRIC RANK
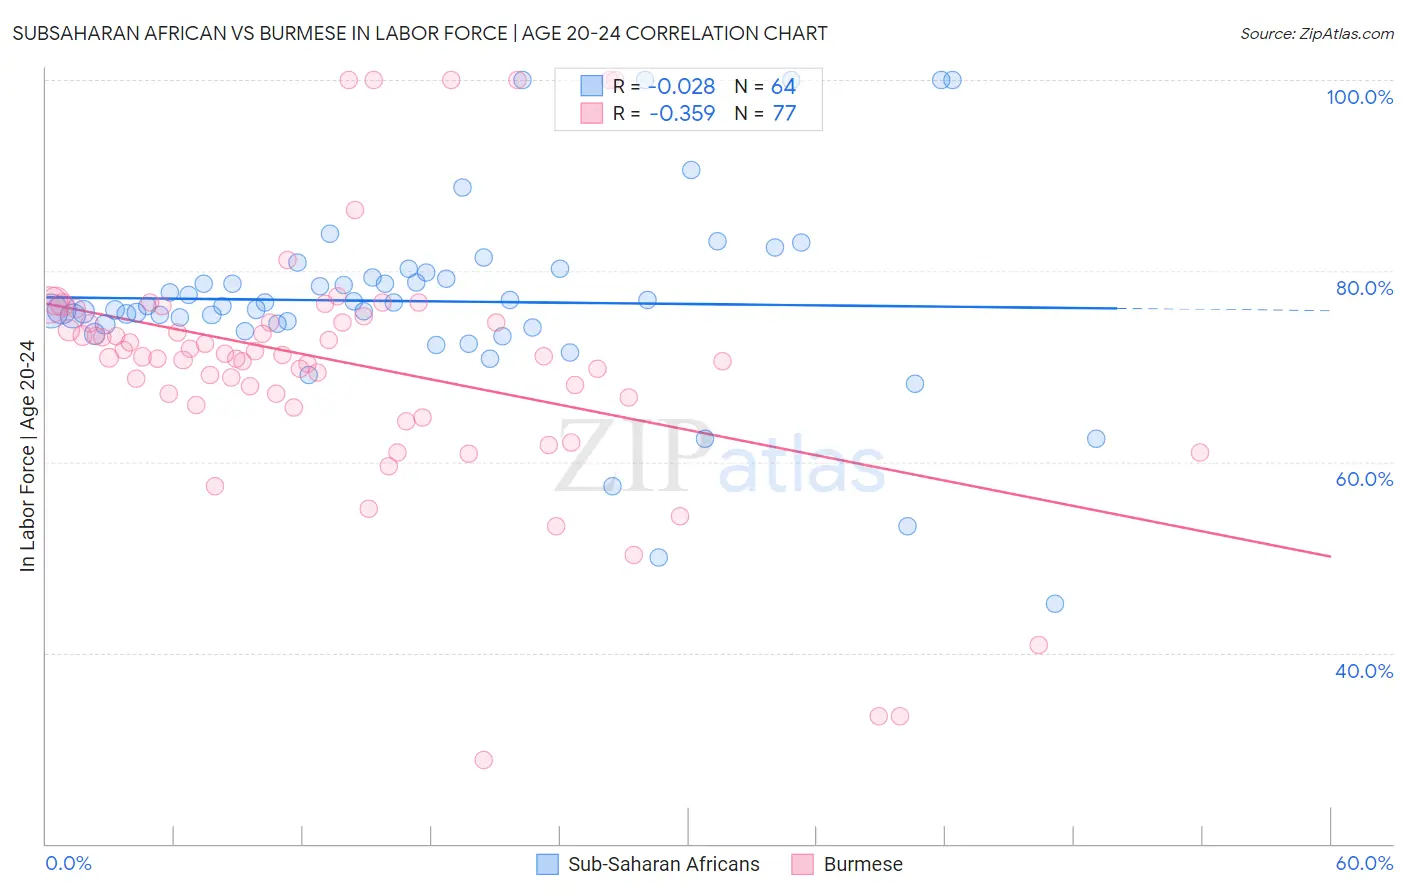
Subsaharan African vs Burmese In Labor Force | Age 20-24 Correlation Chart
The statistical analysis conducted on geographies consisting of 507,882,166 people shows no correlation between the proportion of Sub-Saharan Africans and labor force participation rate among population between the ages 20 and 24 in the United States with a correlation coefficient (R) of -0.028 and weighted average of 75.7%. Similarly, the statistical analysis conducted on geographies consisting of 465,182,635 people shows a mild negative correlation between the proportion of Burmese and labor force participation rate among population between the ages 20 and 24 in the United States with a correlation coefficient (R) of -0.359 and weighted average of 73.6%, a difference of 2.9%.
In Labor Force | Age 20-24 Correlation Summary
| Measurement | Subsaharan African | Burmese |
| Minimum | 45.1% | 28.8% |
| Maximum | 100.0% | 100.0% |
| Range | 54.9% | 71.2% |
| Mean | 76.8% | 70.4% |
| Median | 76.3% | 71.0% |
| Interquartile 25% (IQ1) | 74.3% | 66.3% |
| Interquartile 75% (IQ3) | 79.6% | 75.0% |
| Interquartile Range (IQR) | 5.3% | 8.7% |
| Standard Deviation (Sample) | 10.3% | 13.4% |
| Standard Deviation (Population) | 10.2% | 13.3% |
Similar Demographics by In Labor Force | Age 20-24
Demographics Similar to Sub-Saharan Africans by In Labor Force | Age 20-24
In terms of in labor force | age 20-24, the demographic groups most similar to Sub-Saharan Africans are Immigrants from Afghanistan (75.6%, a difference of 0.060%), Iroquois (75.6%, a difference of 0.070%), Immigrants from Austria (75.6%, a difference of 0.080%), Immigrants from Jordan (75.6%, a difference of 0.090%), and Palestinian (75.6%, a difference of 0.10%).
| Demographics | Rating | Rank | In Labor Force | Age 20-24 |
| Immigrants | Africa | 94.6 /100 | #120 | Exceptional 75.8% |
| Immigrants | Serbia | 94.3 /100 | #121 | Exceptional 75.8% |
| Pakistanis | 94.1 /100 | #122 | Exceptional 75.8% |
| Immigrants | Bulgaria | 94.1 /100 | #123 | Exceptional 75.8% |
| Immigrants | Sierra Leone | 93.8 /100 | #124 | Exceptional 75.8% |
| Immigrants | Scotland | 93.7 /100 | #125 | Exceptional 75.8% |
| Brazilians | 93.0 /100 | #126 | Exceptional 75.8% |
| Sub-Saharan Africans | 90.9 /100 | #127 | Exceptional 75.7% |
| Immigrants | Afghanistan | 89.4 /100 | #128 | Excellent 75.6% |
| Iroquois | 89.1 /100 | #129 | Excellent 75.6% |
| Immigrants | Austria | 88.8 /100 | #130 | Excellent 75.6% |
| Immigrants | Jordan | 88.5 /100 | #131 | Excellent 75.6% |
| Palestinians | 88.4 /100 | #132 | Excellent 75.6% |
| Zimbabweans | 88.2 /100 | #133 | Excellent 75.6% |
| Estonians | 87.1 /100 | #134 | Excellent 75.6% |
Demographics Similar to Burmese by In Labor Force | Age 20-24
In terms of in labor force | age 20-24, the demographic groups most similar to Burmese are Haitian (73.6%, a difference of 0.0%), Immigrants from Haiti (73.6%, a difference of 0.010%), Immigrants from Asia (73.6%, a difference of 0.020%), Immigrants from Western Asia (73.5%, a difference of 0.040%), and South American (73.5%, a difference of 0.090%).
| Demographics | Rating | Rank | In Labor Force | Age 20-24 |
| Egyptians | 0.7 /100 | #258 | Tragic 73.7% |
| Dutch West Indians | 0.7 /100 | #259 | Tragic 73.7% |
| Immigrants | Turkey | 0.7 /100 | #260 | Tragic 73.7% |
| Houma | 0.6 /100 | #261 | Tragic 73.7% |
| Asians | 0.6 /100 | #262 | Tragic 73.7% |
| Immigrants | Asia | 0.5 /100 | #263 | Tragic 73.6% |
| Immigrants | Haiti | 0.5 /100 | #264 | Tragic 73.6% |
| Burmese | 0.5 /100 | #265 | Tragic 73.6% |
| Haitians | 0.5 /100 | #266 | Tragic 73.6% |
| Immigrants | Western Asia | 0.4 /100 | #267 | Tragic 73.5% |
| South Americans | 0.4 /100 | #268 | Tragic 73.5% |
| Colombians | 0.3 /100 | #269 | Tragic 73.5% |
| Immigrants | Russia | 0.3 /100 | #270 | Tragic 73.5% |
| Immigrants | Indonesia | 0.3 /100 | #271 | Tragic 73.4% |
| Belizeans | 0.3 /100 | #272 | Tragic 73.4% |