Irish vs Celtic In Labor Force | Age 35-44
COMPARE
Irish
Celtic
In Labor Force | Age 35-44
In Labor Force | Age 35-44 Comparison
Irish
Celtics
84.4%
IN LABOR FORCE | AGE 35-44
53.1/ 100
METRIC RATING
168th/ 347
METRIC RANK
83.8%
IN LABOR FORCE | AGE 35-44
1.4/ 100
METRIC RATING
239th/ 347
METRIC RANK
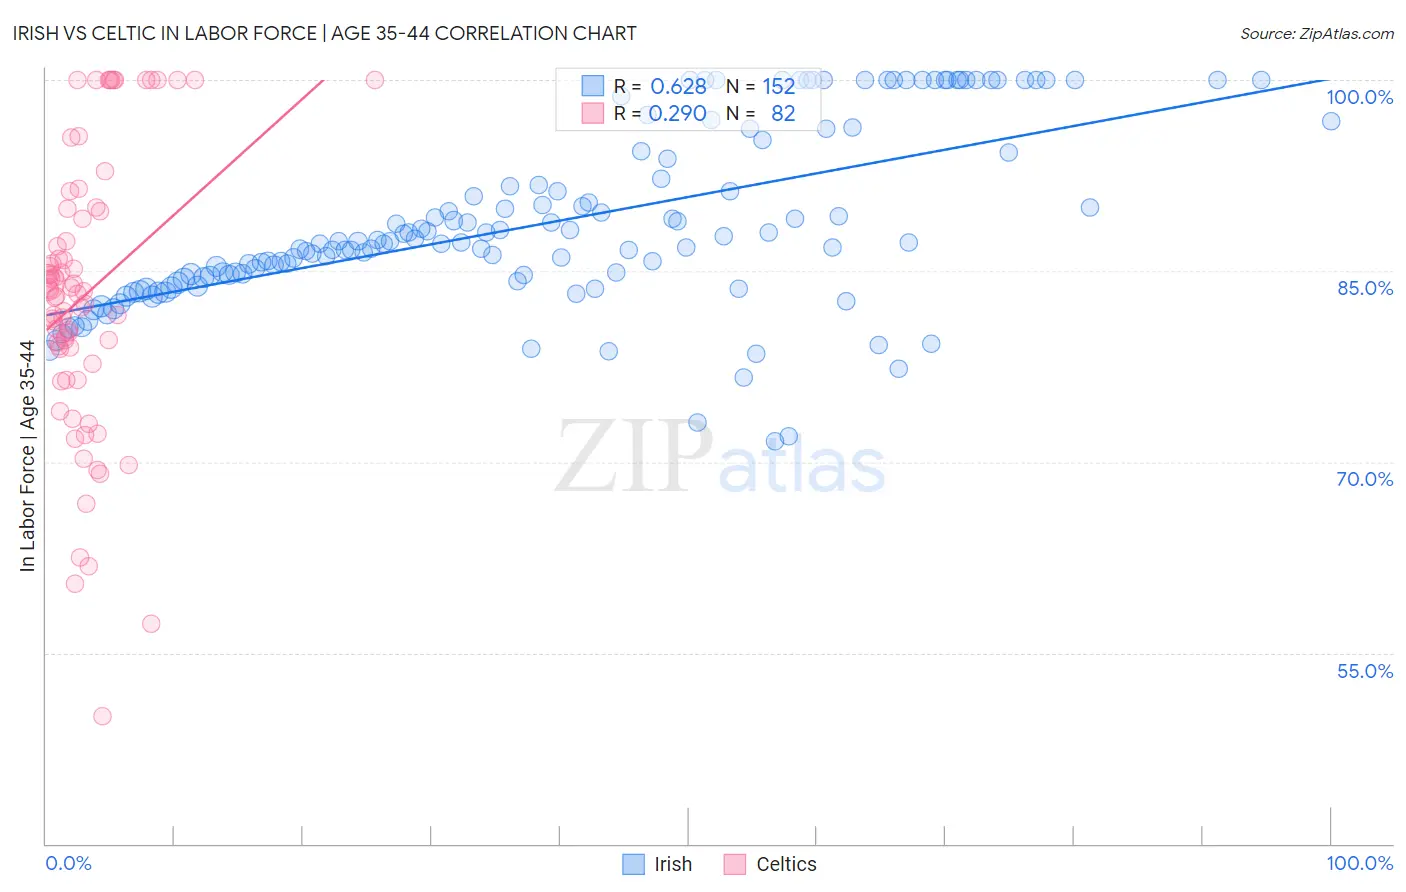
Irish vs Celtic In Labor Force | Age 35-44 Correlation Chart
The statistical analysis conducted on geographies consisting of 579,649,730 people shows a significant positive correlation between the proportion of Irish and labor force participation rate among population between the ages 35 and 44 in the United States with a correlation coefficient (R) of 0.628 and weighted average of 84.4%. Similarly, the statistical analysis conducted on geographies consisting of 168,864,991 people shows a weak positive correlation between the proportion of Celtics and labor force participation rate among population between the ages 35 and 44 in the United States with a correlation coefficient (R) of 0.290 and weighted average of 83.8%, a difference of 0.72%.
In Labor Force | Age 35-44 Correlation Summary
| Measurement | Irish | Celtic |
| Minimum | 71.6% | 50.0% |
| Maximum | 100.0% | 100.0% |
| Range | 28.4% | 50.0% |
| Mean | 88.8% | 83.1% |
| Median | 87.2% | 83.3% |
| Interquartile 25% (IQ1) | 84.4% | 78.9% |
| Interquartile 75% (IQ3) | 94.0% | 89.7% |
| Interquartile Range (IQR) | 9.6% | 10.9% |
| Standard Deviation (Sample) | 7.0% | 10.9% |
| Standard Deviation (Population) | 6.9% | 10.8% |
Similar Demographics by In Labor Force | Age 35-44
Demographics Similar to Irish by In Labor Force | Age 35-44
In terms of in labor force | age 35-44, the demographic groups most similar to Irish are Immigrants from Afghanistan (84.4%, a difference of 0.0%), Immigrants from Jordan (84.4%, a difference of 0.0%), Alsatian (84.4%, a difference of 0.010%), Immigrants from Portugal (84.4%, a difference of 0.010%), and Jordanian (84.4%, a difference of 0.010%).
| Demographics | Rating | Rank | In Labor Force | Age 35-44 |
| Immigrants | Venezuela | 60.0 /100 | #161 | Good 84.4% |
| Immigrants | Hungary | 59.4 /100 | #162 | Average 84.4% |
| Aleuts | 59.1 /100 | #163 | Average 84.4% |
| Nigerians | 58.9 /100 | #164 | Average 84.4% |
| Venezuelans | 58.1 /100 | #165 | Average 84.4% |
| Alsatians | 55.2 /100 | #166 | Average 84.4% |
| Immigrants | Portugal | 55.2 /100 | #167 | Average 84.4% |
| Irish | 53.1 /100 | #168 | Average 84.4% |
| Immigrants | Afghanistan | 52.7 /100 | #169 | Average 84.4% |
| Immigrants | Jordan | 52.5 /100 | #170 | Average 84.4% |
| Jordanians | 51.7 /100 | #171 | Average 84.4% |
| Scandinavians | 51.2 /100 | #172 | Average 84.4% |
| Immigrants | Trinidad and Tobago | 50.7 /100 | #173 | Average 84.4% |
| Immigrants | Iran | 50.0 /100 | #174 | Average 84.4% |
| Pakistanis | 48.2 /100 | #175 | Average 84.4% |
Demographics Similar to Celtics by In Labor Force | Age 35-44
In terms of in labor force | age 35-44, the demographic groups most similar to Celtics are Arab (83.8%, a difference of 0.0%), Iraqi (83.8%, a difference of 0.010%), Immigrants from Laos (83.8%, a difference of 0.030%), Immigrants from Cambodia (83.8%, a difference of 0.030%), and Immigrants from Western Asia (83.8%, a difference of 0.030%).
| Demographics | Rating | Rank | In Labor Force | Age 35-44 |
| Native Hawaiians | 3.0 /100 | #232 | Tragic 83.9% |
| Immigrants | Germany | 2.8 /100 | #233 | Tragic 83.9% |
| Immigrants | Oceania | 2.6 /100 | #234 | Tragic 83.9% |
| Immigrants | Syria | 2.5 /100 | #235 | Tragic 83.9% |
| West Indians | 2.4 /100 | #236 | Tragic 83.9% |
| English | 1.8 /100 | #237 | Tragic 83.8% |
| Immigrants | Laos | 1.7 /100 | #238 | Tragic 83.8% |
| Celtics | 1.4 /100 | #239 | Tragic 83.8% |
| Arabs | 1.3 /100 | #240 | Tragic 83.8% |
| Iraqis | 1.3 /100 | #241 | Tragic 83.8% |
| Immigrants | Cambodia | 1.1 /100 | #242 | Tragic 83.8% |
| Immigrants | Western Asia | 1.1 /100 | #243 | Tragic 83.8% |
| Guyanese | 1.1 /100 | #244 | Tragic 83.8% |
| Malaysians | 1.1 /100 | #245 | Tragic 83.8% |
| Immigrants | Immigrants | 1.0 /100 | #246 | Tragic 83.7% |