Immigrants from Middle Africa vs Immigrants from Panama In Labor Force | Age 16-19
COMPARE
Immigrants from Middle Africa
Immigrants from Panama
In Labor Force | Age 16-19
In Labor Force | Age 16-19 Comparison
Immigrants from Middle Africa
Immigrants from Panama
39.9%
IN LABOR FORCE | AGE 16-19
99.9/ 100
METRIC RATING
73rd/ 347
METRIC RANK
34.0%
IN LABOR FORCE | AGE 16-19
0.4/ 100
METRIC RATING
273rd/ 347
METRIC RANK
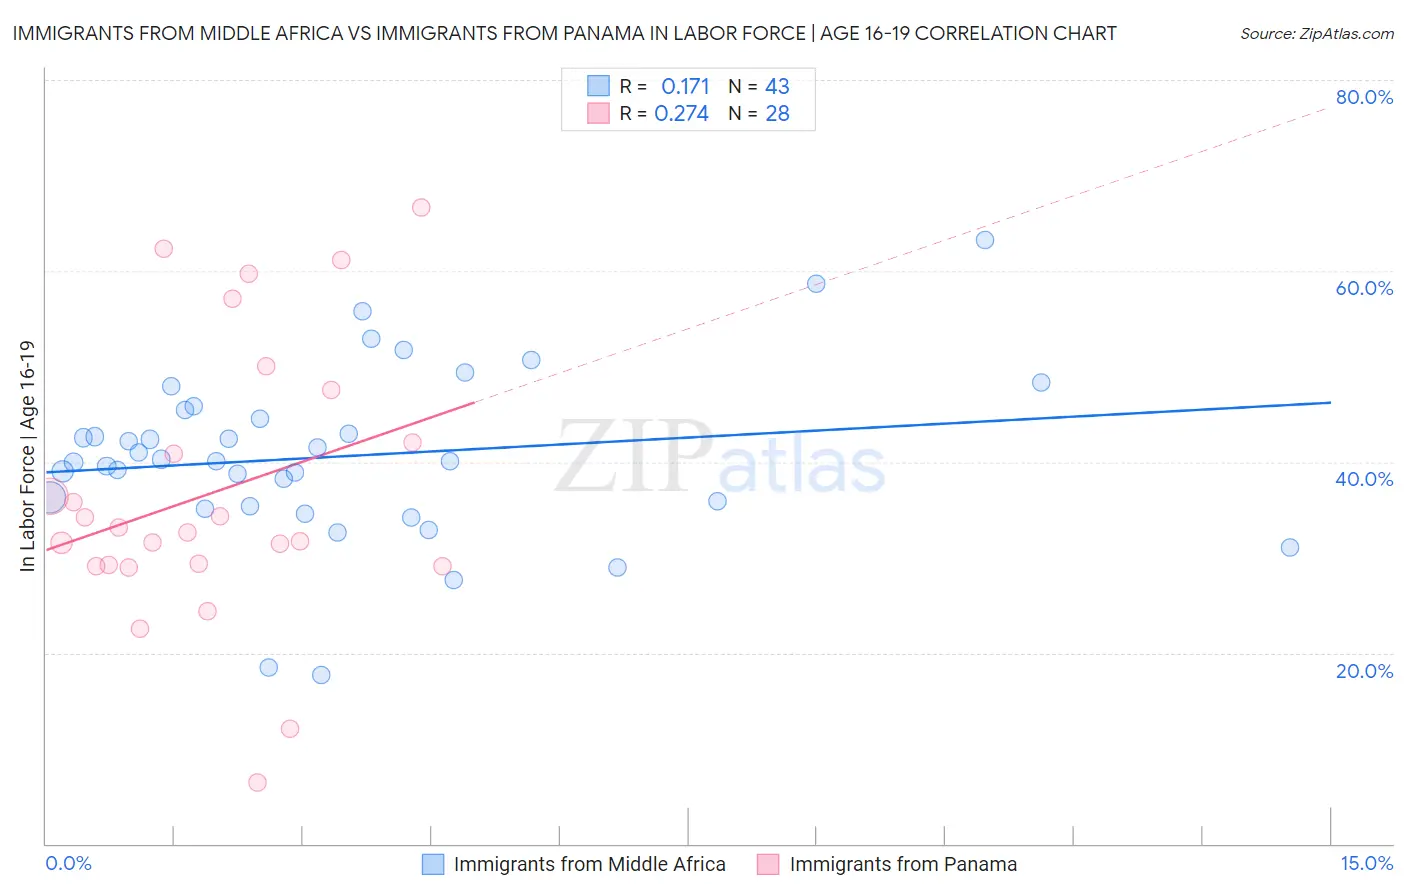
Immigrants from Middle Africa vs Immigrants from Panama In Labor Force | Age 16-19 Correlation Chart
The statistical analysis conducted on geographies consisting of 202,678,432 people shows a poor positive correlation between the proportion of Immigrants from Middle Africa and labor force participation rate among population between the ages 16 and 19 in the United States with a correlation coefficient (R) of 0.171 and weighted average of 39.9%. Similarly, the statistical analysis conducted on geographies consisting of 221,074,600 people shows a weak positive correlation between the proportion of Immigrants from Panama and labor force participation rate among population between the ages 16 and 19 in the United States with a correlation coefficient (R) of 0.274 and weighted average of 34.0%, a difference of 17.5%.
In Labor Force | Age 16-19 Correlation Summary
| Measurement | Immigrants from Middle Africa | Immigrants from Panama |
| Minimum | 17.7% | 6.4% |
| Maximum | 63.3% | 66.7% |
| Range | 45.6% | 60.3% |
| Mean | 40.6% | 36.8% |
| Median | 40.1% | 32.8% |
| Interquartile 25% (IQ1) | 35.3% | 29.2% |
| Interquartile 75% (IQ3) | 45.4% | 44.8% |
| Interquartile Range (IQR) | 10.1% | 15.6% |
| Standard Deviation (Sample) | 9.1% | 14.6% |
| Standard Deviation (Population) | 9.0% | 14.3% |
Similar Demographics by In Labor Force | Age 16-19
Demographics Similar to Immigrants from Middle Africa by In Labor Force | Age 16-19
In terms of in labor force | age 16-19, the demographic groups most similar to Immigrants from Middle Africa are Iroquois (39.9%, a difference of 0.030%), Serbian (39.9%, a difference of 0.040%), Portuguese (40.0%, a difference of 0.21%), Hungarian (39.8%, a difference of 0.23%), and French American Indian (39.8%, a difference of 0.25%).
| Demographics | Rating | Rank | In Labor Force | Age 16-19 |
| Immigrants | Nonimmigrants | 100.0 /100 | #66 | Exceptional 40.1% |
| Canadians | 100.0 /100 | #67 | Exceptional 40.1% |
| Italians | 99.9 /100 | #68 | Exceptional 40.1% |
| Potawatomi | 99.9 /100 | #69 | Exceptional 40.0% |
| Portuguese | 99.9 /100 | #70 | Exceptional 40.0% |
| Serbians | 99.9 /100 | #71 | Exceptional 39.9% |
| Iroquois | 99.9 /100 | #72 | Exceptional 39.9% |
| Immigrants | Middle Africa | 99.9 /100 | #73 | Exceptional 39.9% |
| Hungarians | 99.9 /100 | #74 | Exceptional 39.8% |
| French American Indians | 99.9 /100 | #75 | Exceptional 39.8% |
| Malaysians | 99.9 /100 | #76 | Exceptional 39.7% |
| Immigrants | Portugal | 99.9 /100 | #77 | Exceptional 39.7% |
| Austrians | 99.8 /100 | #78 | Exceptional 39.5% |
| Marshallese | 99.8 /100 | #79 | Exceptional 39.5% |
| Immigrants | Iraq | 99.8 /100 | #80 | Exceptional 39.4% |
Demographics Similar to Immigrants from Panama by In Labor Force | Age 16-19
In terms of in labor force | age 16-19, the demographic groups most similar to Immigrants from Panama are Venezuelan (34.0%, a difference of 0.090%), Immigrants from Fiji (33.9%, a difference of 0.18%), Asian (34.1%, a difference of 0.22%), Immigrants from Russia (34.1%, a difference of 0.24%), and Central American Indian (34.1%, a difference of 0.24%).
| Demographics | Rating | Rank | In Labor Force | Age 16-19 |
| Immigrants | Malaysia | 0.7 /100 | #266 | Tragic 34.3% |
| Immigrants | Peru | 0.5 /100 | #267 | Tragic 34.2% |
| Immigrants | Asia | 0.5 /100 | #268 | Tragic 34.1% |
| Pima | 0.5 /100 | #269 | Tragic 34.1% |
| Immigrants | Russia | 0.4 /100 | #270 | Tragic 34.1% |
| Central American Indians | 0.4 /100 | #271 | Tragic 34.1% |
| Asians | 0.4 /100 | #272 | Tragic 34.1% |
| Immigrants | Panama | 0.4 /100 | #273 | Tragic 34.0% |
| Venezuelans | 0.3 /100 | #274 | Tragic 34.0% |
| Immigrants | Fiji | 0.3 /100 | #275 | Tragic 33.9% |
| Immigrants | Latin America | 0.3 /100 | #276 | Tragic 33.9% |
| Menominee | 0.3 /100 | #277 | Tragic 33.9% |
| Colombians | 0.3 /100 | #278 | Tragic 33.8% |
| Paraguayans | 0.3 /100 | #279 | Tragic 33.8% |
| Taiwanese | 0.3 /100 | #280 | Tragic 33.8% |